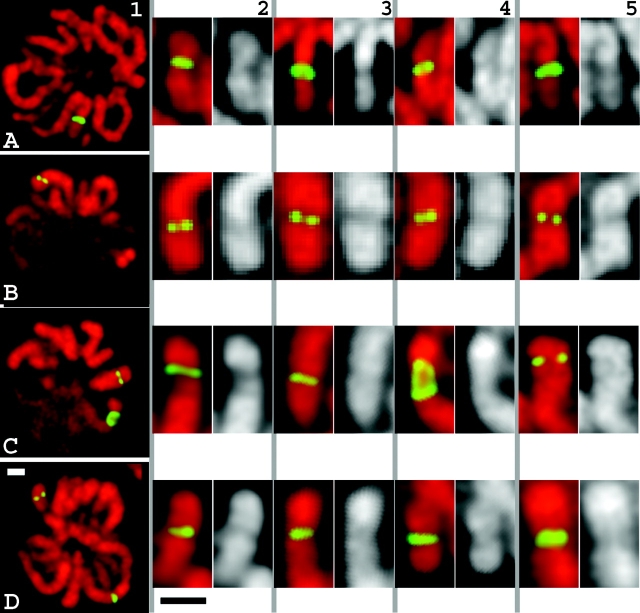
Figure 5.
Normal chromosome morphology over insert regions by light microscopy. In native chromosomes, the vector insert appears as a band going over the entire width of the chromosome, or as a pair of spots within normal diameter chromosome. (A) Con-1 clone showing insert across entire chromosome width. (B) Con-610 clone with single insert site. (C) dSAR-d11 clone showing two insert sites. (D) dSAR-g12 clone showing two insert sites. (column 1) Lac repressor immunostaining (green) and DAPI staining (red) of metaphase cells; (columns 2–4) metaphase chromosomes at vector integration sites: lac repressor immunostaining (green), DAPI staining (red, or grayscale). (column 5) Chromosome structure at the regions of vector insertion for cells expressing GFP–lacI–NLS fusion protein. Bars, 1 μm (white, column 1; black, columns 2–5).

