
Figure 4.
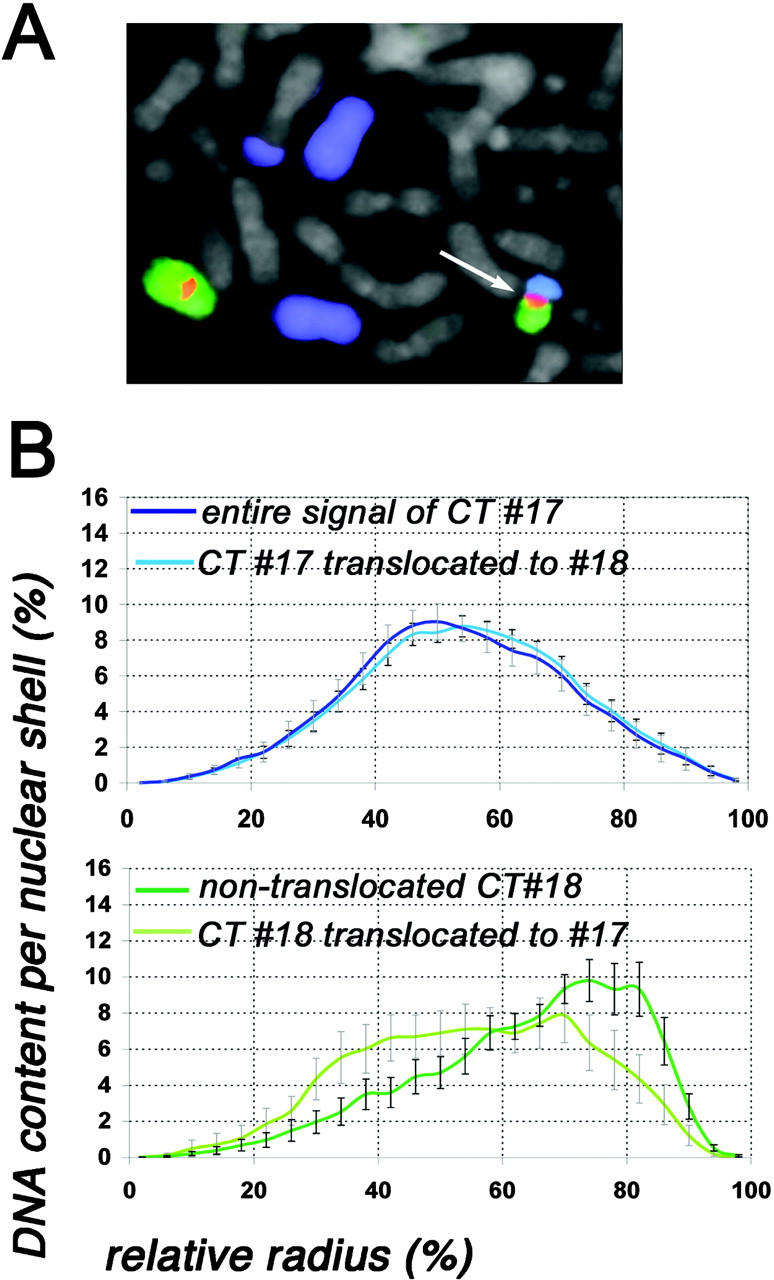
Evaluation of CT #17 and CT #18 distribution of the SW620 cell line carrying a translocation t(17;18). (A) Part of a metaphase spread after painting of chromosome 17 (visualized in blue) and chromosome 18 (visualized in green). The chromosome 18 centromere is visualized in red. In the metaphase shown, chromosome 17 is present as two free, normal copies and as two different translocation chromosomes, one of them forming the der(18)t(17;18) (arrow). The centromere of this rearranged chromosome is chromosome 18 specific. Chromosome 18 is also present as one normal copy. (B) Quantitative 3D evaluation of the radial CT #17 and CT #18 distribution in 22 nuclei. The abscissa denotes the relative radius r of the nuclear shells, the ordinate the normalized sum of intensities in the voxels for a respective fluorochrome assigned to a given shell. In the top panel, the dark blue curve denotes the radial distribution of the entire chromosome 17 material after painting with a DNA probe specific for chromosome 17, and the light blue curve denotes only chromosome 17 material translocated to chromosome 18. Note the almost identical curves for both fractions of CT #17 material. In the bottom panel, the dark green curve denotes the radial distribution of free CTs #18, and the light green curve denotes chromosome 18 material translocated to chromosome 17. Note the distinctly more peripheral positioning of the nontranslocated fraction of CTs #18 in comparison to the translocated fraction. Bars indicate SEM.