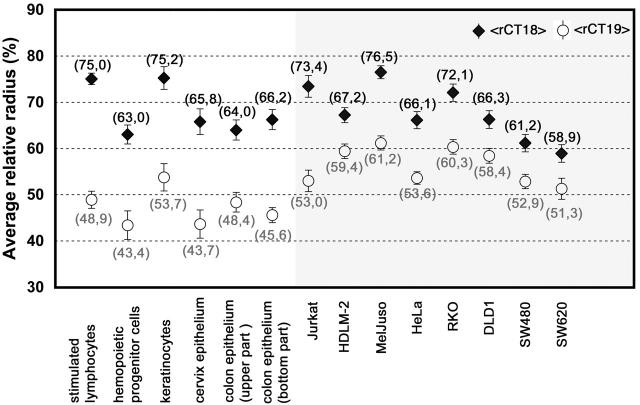
Figure 5.
Comparison of the average relative radii of the intensity-weighted fluorescence, represented by CT #18 (black rhombi) and CT #19 (white circles) material of all cell types analyzed. The left panel (white background) displays the data of normal cells, the right panel (gray background) the data of tumor cells. In all cell types, the average relative radius for CT #18 (<rCT18>) is larger compared with CT #19 (<rCT19>). The distances between <rCT18> and <rCT19> are smaller in the majority of tumor cell lines in comparison to normal cell nuclei (compare with Table III). Numbers in parentheses indicate the exact value of the average relative radii.

