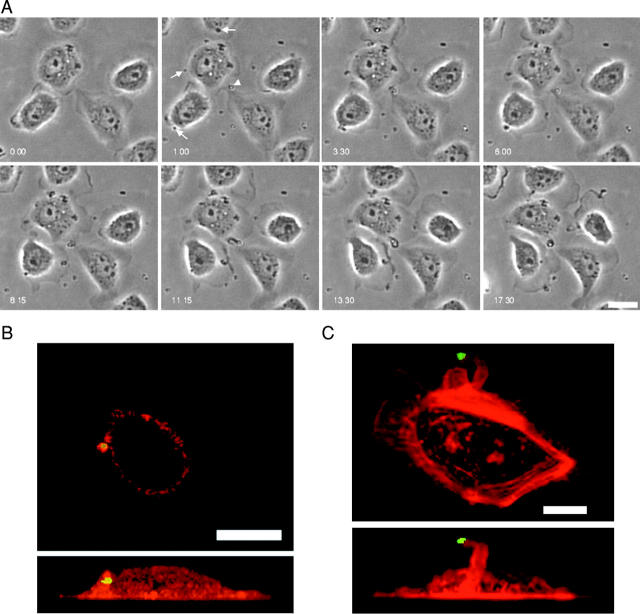
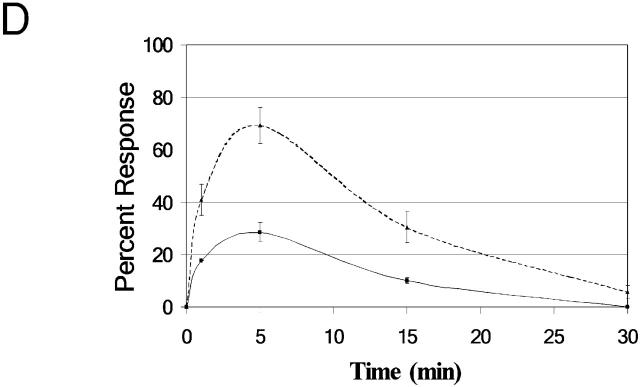
Figure 1.
Responses to EGF-coated beads. (A) MTLn3:EGFR cells were imaged before (first frame, 0.00) and after the addition of EGF beads (1.00 to 17 min 30 s). Arrows indicate beads that induced localized phase densities in subsequent images and the arrowhead indicates a bead that induced a protrusion (Video 1). Bar, 20 μm. (B) Projections from a confocal z series of cells stimulated for 5 min by EGF beads. F-actin is in red and the bead in green. (Top) Confocal slice through the bead region. (Bottom) Side view projection. Bar, 10 μm. (C) Projections from a confocal z series of a protrusion induced by an EGF bead. Bar, 10 μm. See Videos 2 and 3 for rotations of B and C. (D) Kinetics of actin polymerization. The dashed curve represents all positive responses as indicated by increased rhodamine phalloidin staining (including protrusions). The solid curve represents protrusions only. Data represent the mean ± SEM of three experiments; n = 50 for each experiment. All videos are available at http://www.jcb.org/cgi/content/full/jcb.200303144/DC1.


