
Figure 3.
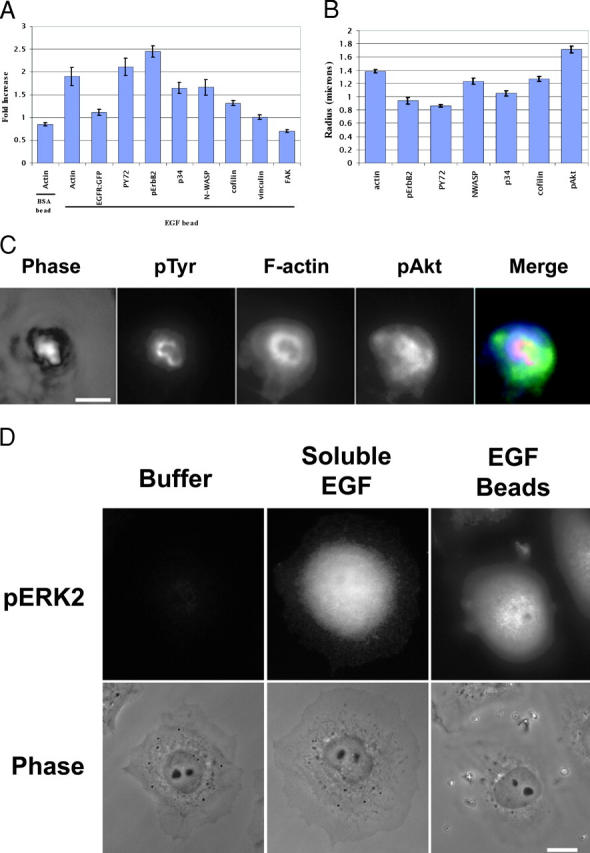
Localization of signaling proteins around EGF beads. (A) The relative increase in signal for the indicated molecule near the bead (5 min after application), relative to plasma membranes far from the bead in the same plane of focus, is given. Data are mean ± SEM from >33 cells in two or more separate experiments. (B) The areas of increased intensity of the samples measured in A were determined, and a radius calculated, assuming a circular shape. Means and SEM from >33 cells in two or more experiments are shown. (C) Comparison of phase, phosphotyrosine (pTyr, red), F-actin (blue), and phosphoAkt (pAkt, green) distributions in one cell stimulated with an EGF bead. Bar, 2 μm. (D) Global ERK activation. Cells were stimulated with buffer (left), 10 nM soluble EGF (middle), or EGF beads (right) for 5 min and then fixed and stained for phosphoERK (fluorescence on top, phase images on bottom). Beads are phase bright in the right hand phase image. Bar, 10 μm.