Figure 2.
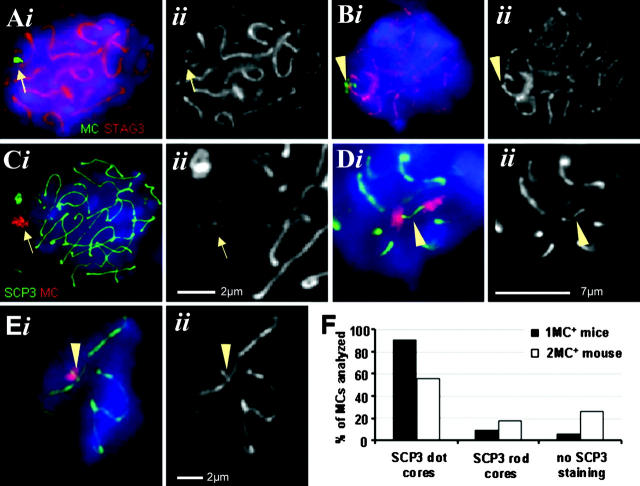
MCs assemble a cohesin and AE core. (A) IF staining for STAG3 (red) combined with MC FISH (green) on a monosomic pachytene nucleus. (Aii and Eii) Details showing the respective chromosome core in grayscale. A dotlike STAG3 signal (arrow) is present on the MC. (B) A connecting STAG3-positive structure (arrowhead) between the MC and the cohesin core of a monosomic mouse bivalent. (C–E) IF staining for SCP3 (green) combined with α-satellite MC FISH (red) on pachytene nuclei. (C) A dotlike SCP3 signal (arrow) is detected at the MC in a monosomic spermatocyte nucleus close to the LE of the X chromosome. (Cii) Enlarged detail showing the chromosome core (arrow). (D) A SCP3 rod (arrowhead) connects two MCs in a spermatocyte I of a disomic mouse (note that this is the most extended rod observed). (E) A rodlike SCP3-positive structure (arrowhead) connects the MC with the SC of a monosomic mouse bivalent. (A–E) Images were taken of three-dimensionally preserved nuclei such that the focal planes were at the position of the SCP or STAG3 signals. Bars in Cii and Eii represent 2 μm; bar in Dii is 7 μm. (F) Frequencies of the SCP3 dot- and rodlike staining (based on ≥ 50 nuclei).

