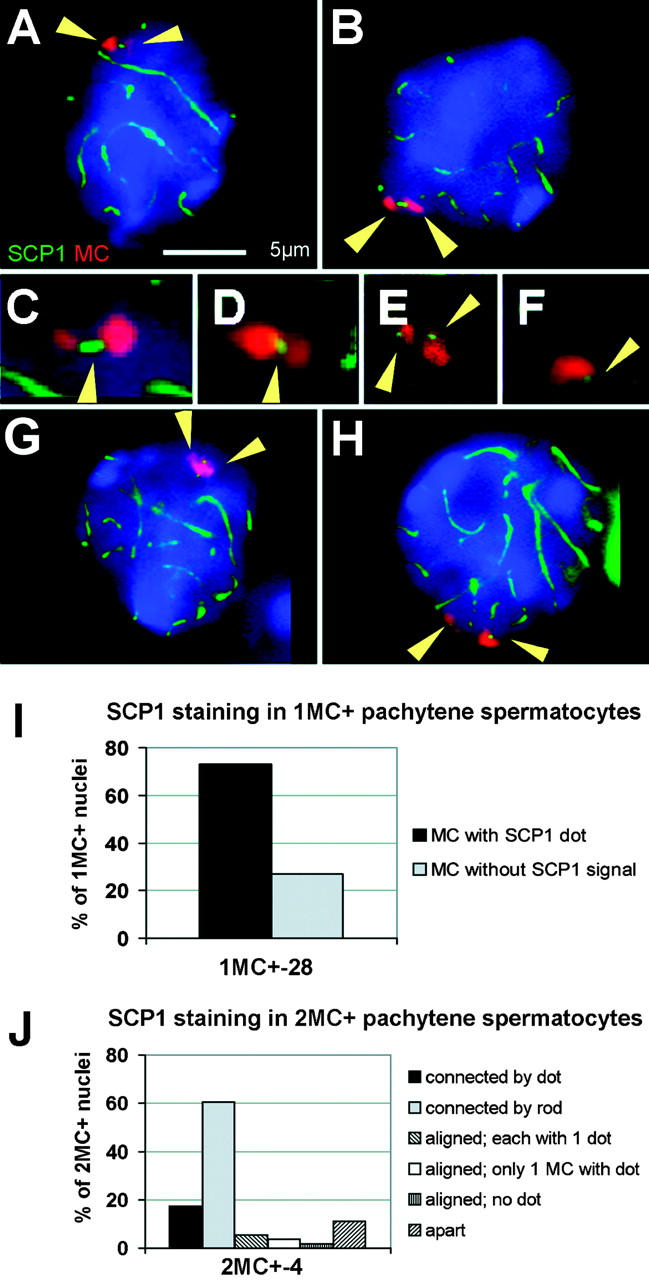
Figure 3.

MCs contain SCP1. (A–E, G, and H) Disomic pachytene spermatocytes stained for SCP1 (green; IF staining; arrowheads in C–F) and the MC (red; FISH; arrowheads in A, B, G, and H) show either dotlike SCP1 signals at separate (H), juxtaposed (E), and paired (G) MCs, or rodlike (B and C) and dotlike (A and D) SCP1 cores between MCs. The bar in A represents 5 μm and also applies to B, G, and H. (F) Dotlike SCP1 signal (arrowhead) detected at the MC of a monosomic pachytene spermatocyte. (I and J) Frequencies of the different SCP1 staining patterns in monosomic and disomic pachytene nuclei.
