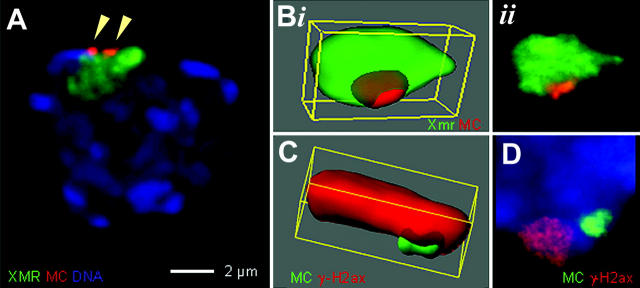
Figure 5.
MC/XY body associations as revealed by 3D imaging. (A) Disomic pachytene nucleus (2MC+-6) shows the XY body (as defined by XMR IF staining, green) associated with two separated MCs (red signals, α-satellite FISH; arrowheads). The image represents the projection of 10 optical sections encompassing the XY body as obtained by 3D imaging. Bar, 2 μm. (Bi) Deconvoluted 3D volume image from image planes encompassing an XY body from another disomic nucleus. The two paired MCs (one large red signal) are partially embedded (indicated by the shadowed part of the MC signal) in the XY body chromatin (green). (Bii) Shows a projection of the images before volume imaging. (C) Volume reconstruction of a γ-H2ax–stained XY body (red) and associated MCs (green). The paired MCs appear partially embedded in the XY chromatin. (D) Disomic spermatocyte (DNA blue; partial detail) showing the MC bivalent signal distant from the γ-H2ax–stained XY body (red). The paired MCs lack γ-H2ax signals.

