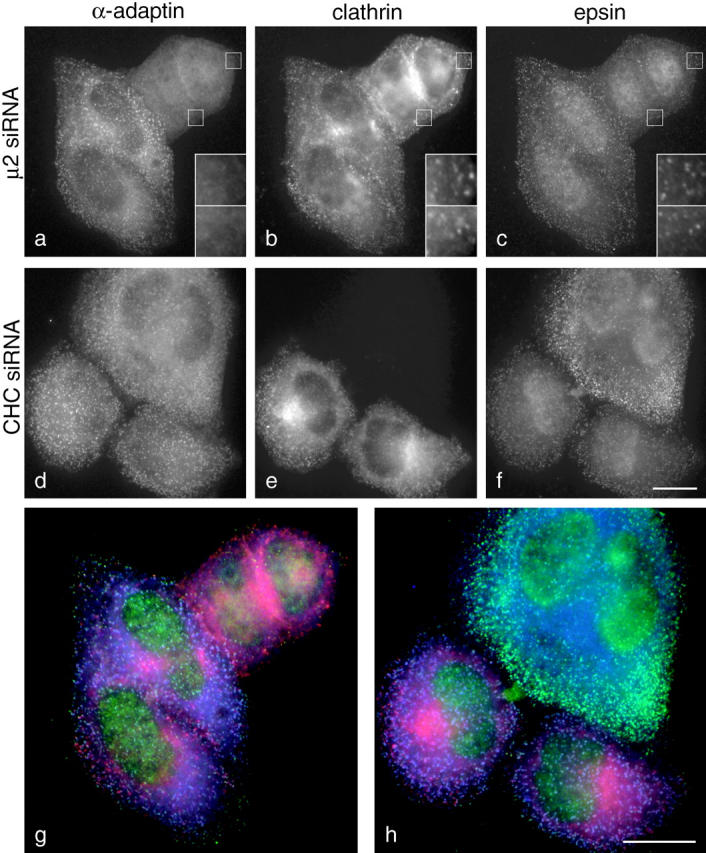
Figure 2.

Immunofluorescence triple labeling of control and siRNA-treated cells plated together. (a–c and g). Cells treated with μ2-2 and control cells were labeled with mouse anti-α-adaptin (a; blue in g), rabbit anti-clathrin (b; red in g), and goat anti-epsin 1 (c; green in g). α-Adaptin is cytosolic in the μ2-depleted cells. Clathrin is still membrane-associated; however, many of these membranes are intracellular. Epsin spots are reduced in number, but are still present in the μ2-depleted cells. Many of these spots are also positive for clathrin. The two boxed-in regions are shown at higher magnification in the bottom right corner of all the panels in a–c. (d–f and h) Cells treated with chc-2 and control cells were labeled with mouse anti-α-adaptin (d; blue in h), rabbit anti-clathrin (e; red in h), and goat anti-epsin (f; green in h). Clathrin is undetectable in the siRNA-treated cells. α-Adaptin labeling is not markedly different; however, epsin labeling is brighter in the clathrin-depleted cells. Bars, 20 μm.
