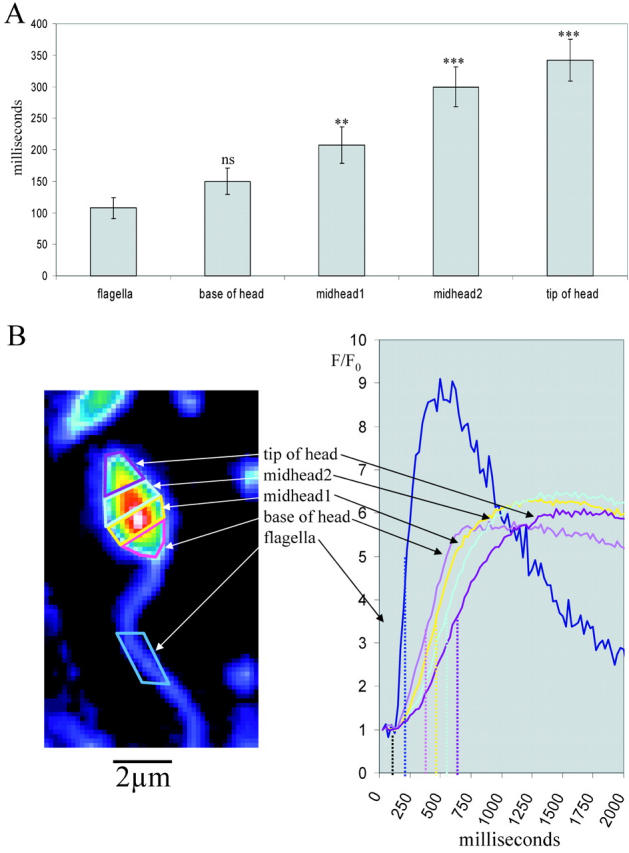
Figure 3.

Subregional analysis of [Ca2 + ]i increases in individual sperm. (A) After addition of 100 nM speract, the time taken for the initial calcium increase to reach half height (relative to the first point of increase in the flagellum) was recorded for subregions of the sperm head and flagellum (B); n = 5, error bars indicate ± SEM. One-tailed t test (comparison to flagellum). ***, P < 0.001; **, P < 0.01; ns, P > 0.05.
