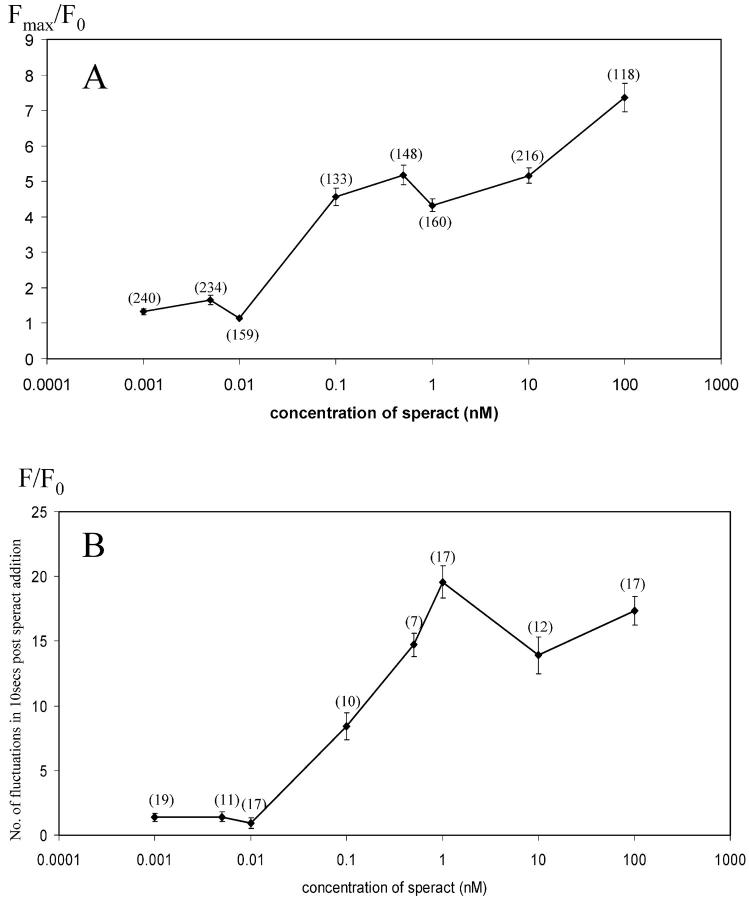
Figure 4.
The magnitude of the tonic calcium increase and the frequency of the phasic calcium fluctuations are dependent on the concentration of speract. (A) For each sperm head, the ratio increase in [Ca2+]i was determined from the maximum fluorescence intensity post-speract addition (Fmax) and the initial fluorescence intensity value (F0). Fmax/F0 is presented as the average of all sperm heads analyzed (total number of sperm heads at each speract concentration shown in brackets). Error bars indicate ± SEM. At concentrations of speract above and including 100 pM, only those sperm heads that showed a response to speract were analyzed. At concentrations of speract below and including 10 pM, and in control analyses, sperm heads were chosen at random. (B) Changes in [Ca2+]i were determined for individual flagella by ratioing their fluorescence (F) against their initial fluorescence (F0). The number of fluctuations occurring after speract addition was determined by including all excursions whose increase from trough to peak was >20% of the trough value. Data are presented as the average number of fluctuations occurring in 10 s post-speract addition per flagellum. Number of flagella analyzed indicated in brackets. Error bars represent ± SEM.

