Figure 6.

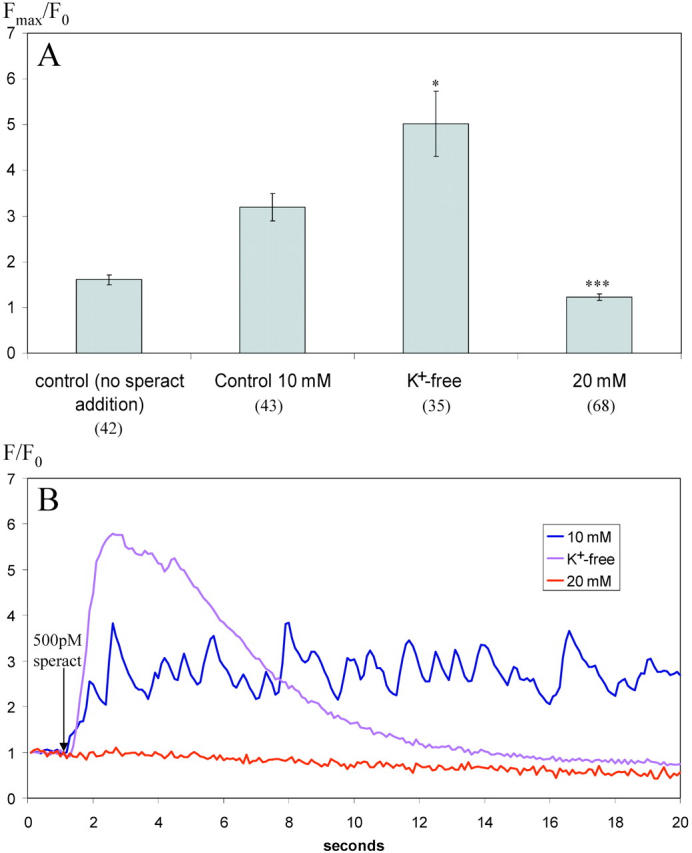
The degree and characteristics of speract-induced increases in [Ca2 + ]i are altered by both increasing and decreasing [K + ]e. (A) For each sperm head, the ratio increase in [Ca2+]i was determined from the maximum fluorescence intensity after addition of speract to a final concentration of 500 pM (Fmax) and the initial fluorescence intensity value (F0). Fmax/F0 is presented as the average of all sperm heads analyzed (total number of sperm heads at each [K+]e shown in brackets). Error bars represent ± SEM. (B) Typical responses in individual sperm heads at different [K+]e. F/F0 shown over time after addition of speract to a final concentration of 500 pM (indicated by arrow). Images acquired at 10 frames per second with 100-ms individual frame exposure time. One-tailed t test (comparison to 10 mM data) ***, P < 0.001; *, P < 0.05.
