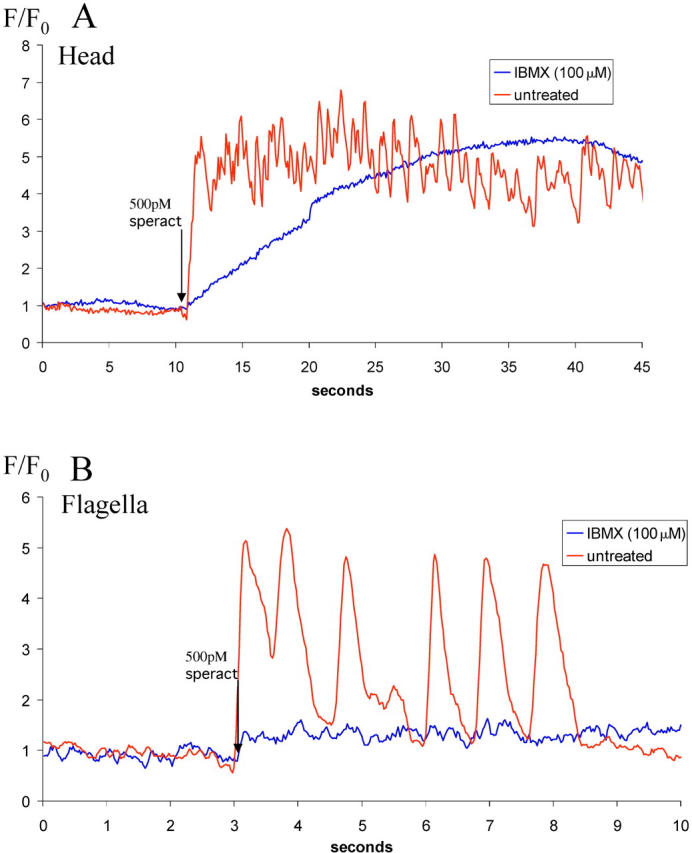
Figure 9.

Representative examples of the effect of IBMX treatment on speract-induced [Ca2 + ]i increases in individual sperm. (A) Effect of IBMX treatment on Ca2+ increase in sperm heads. Images acquired at 10 frames per second with 100-ms individual frame exposure time. (B) Effect of IBMX treatment on [Ca2+]i increase in sperm flagella. Images acquired at 40 frames per second with 25-ms individual frame exposure time. In both A and B, blue traces from sperm treated with 100 μM IBMX before addition of 500 pM speract (indicated by arrow); red trace from non-IBMX–treated sperm. Changes in [Ca2+]i were determined for heads and flagella by pseudo-ratioing their fluorescence (F) against their initial fluorescence (F0).
