
Figure 4.
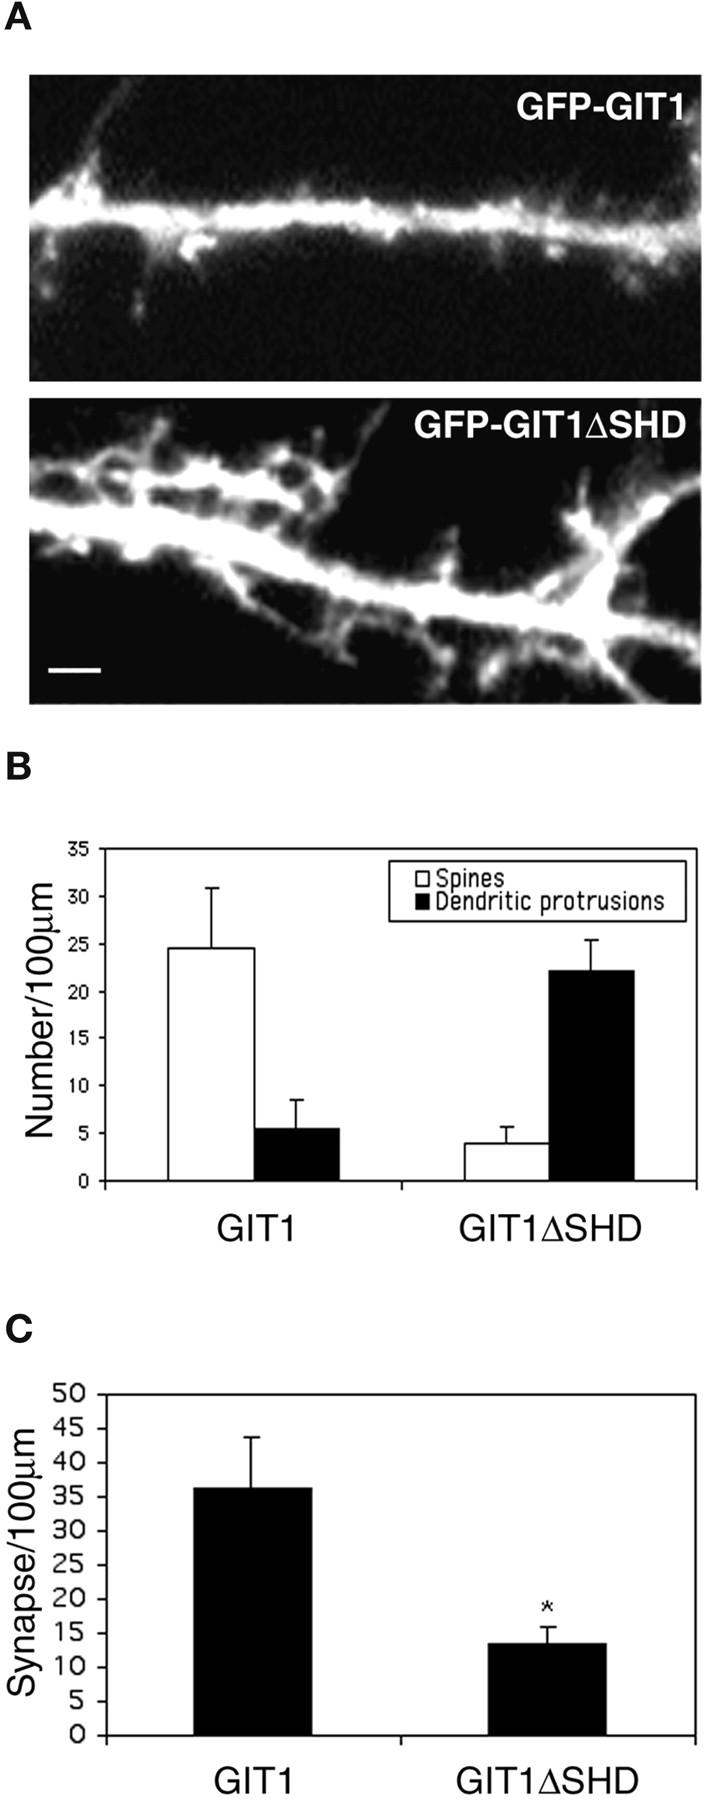
GIT1ΔSHD-expressing neurons show a phenotype similar to SLD-expressing neurons. (A) Hippocampal neurons were transfected with either GFP-GIT1 or GFP-GIT1ΔSHD at day 7 in culture and imaged at day 14 in culture. Note the increase in dendritic protrusions in GIT1ΔSHD-expressing neurons. Bar, 2 μm. (B) Quantification of the number of spines and dendritic protrusions in GIT1- and GIT1ΔSHD-expressing neurons. (C) Quantification of the synaptic density in GIT1- and GIT1ΔSHD-expressing neurons. The difference between GIT1 and GIT1ΔSHD was statistically significant as determined by Student's t test (*P < 0.0001).