
Figure 3.
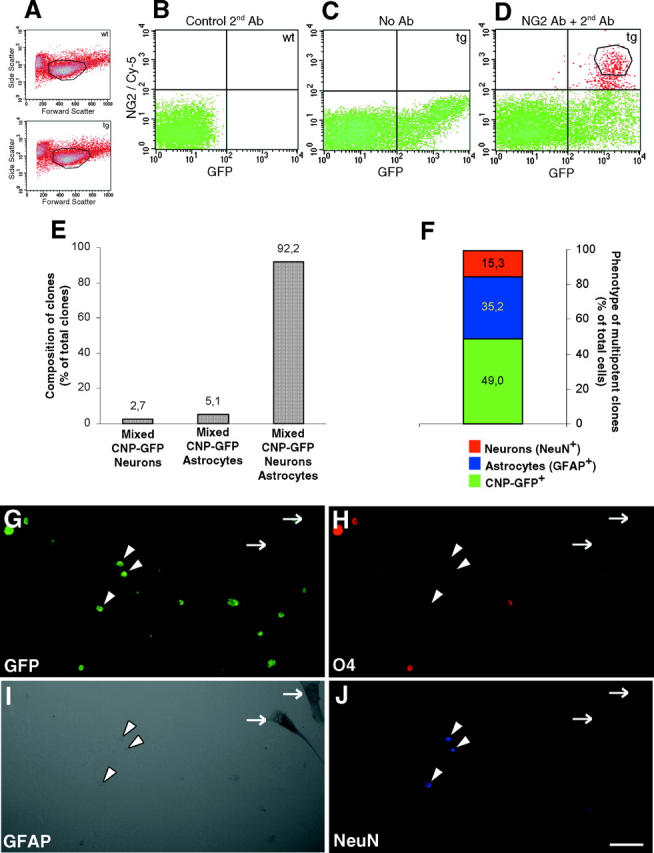
Clonal analysis of NG2 + /CNP-GFP + cells in vitro. (A) FACS® dot plots of acutely dissociated cells from wild-type (wt, top) and CNP-GFP transgenic brains (tg, bottom), in forward and side scatter with a polygon indicating the gate selecting the viable cells. (B–D) Sorting profiles of acutely isolated cell suspensions from P2 brains of wild-type (B) and CNP-GFP transgenic mice (C and D) dot plotted according to fluorescence intensity for GFP (x axis, logarithmic scale) and Cy-5 (fluorescence associated to secondary antibody recognizing NG2 immunoreactivity, y axis, logarithmic scale). (B) Control wild-type cells that were incubated only with the Cy-5–conjugated secondary antibody without anti-NG2 primary antibody. Crossed black lines in B–D represent thresholds of fluorescence. It was observed that <0.01% (limit of detection) of the control cells from B fell over this threshold. Thus, these lines determined the level of fluorescence above which cells from CNP-GFP brains (C) were selected as GFP+ (lower right quadrant). When CNP-GFP cell suspensions were immunostained for NG2 (D), NG2+/CNP-GFP+ cells were detected in upper right quadrant. To ensure accurate purification of NG2+/CNP-GFP+ cells, the sort gate for these cells (D, polygon) was defined by taking an additional margin (0.2–0.3 log units) with respect to background fluorescence levels. (E) FACS®-purified early postnatal (P2) NG2+/CNP-GFP+ cells were cultured at clonal density for 1 wk in SCM and the phenotype of resulting cell clones was then determined. (F) Relative proportion of the different subpopulations found in the multipotent clones, i.e., containing CNP-GFP+ cells, as well as neurons (NeuN+) and astrocytes (GFAP+). (G–J) GFP fluorescence (G, green), O4 (H, red), GFAP (I, peroxidase reaction), and NeuN (J, blue) stainings of the same microscopic field showing a representative multipotent clone derived from the growth of a single NG2+/CNP-GFP+ cell after one week in SCM. NeuN+ cells (arrowheads) are still retaining CNP-GFP fluorescence at this stage, whereas in GFAP+ astrocytes GFP expression has been lost (arrows). Bar, 50 μm for G–J.