
Figure 2.
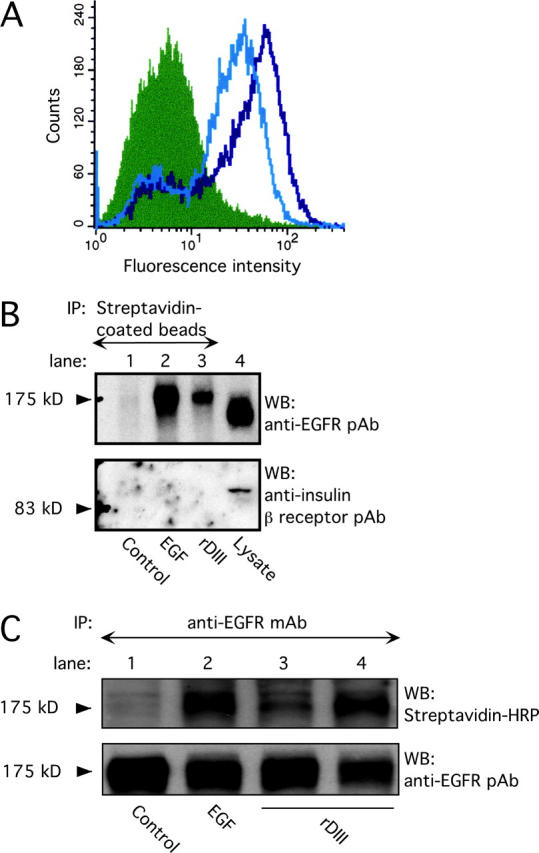
Binding of rDIII to EGFR. (A) rDIII binding to cell surfaces detected by flow cytometry. MDA-MB-231 cells were incubated with 4.5 (open black histogram) or 2 μM (open gray) rDIII or control rabbit IgG (filled), followed by 2778, and the appropriate Alexa®-conjugated secondary antibody. (B) Recovery of biotin–rDIII–EGFR complexes with streptavidin-coated beads. 1.5 μM biotinylated rDIII or 0.75 μM EGF was incubated with MDA-MB-231 cells, followed by cross-linking with BS3. After detergent solubilization, cell lysates were precipitated with streptavidin-coated beads. WB of adsorbed material with EGFR pAb (top) detected a distinct band of 175 kD in samples containing rDIII (lane 3) or EGF (lane 2), but not in control samples (lane 1, no ligand). To control for EGFR expression and specificity of cross-linking to EGFR, total MDA-MB-231 cell lysates were loaded in lane 4 and stripped blots were treated with anti-insulin receptor β antibody (bottom), respectively. (C) Immunoprecipitation of biotin–rDIII–EGFR complexes with antibodies to EGFR. Cells were treated with biotinylated rDIII or EGF and BS3, and cell lysates were immunoprecipitated with EGFR mAb. Samples were analyzed by WB using streptavidin-HRP and ECL. A distinct band at 175 kD was visible for samples containing EGF (lane 2, 0.75 μM) or rDIII (lane 3, 1.0 μM, and lane 4, 1.5 μM; top). There is no corresponding band in the control lane (lane 1; no ligand). Note, the resolution of the gradient gels used is not sufficient to distinguish between EGF or rDIII bound to EGFR, where the former would be expected to run at ∼180 kD and the latter at ∼195 kD. To ensure equal loading in each lane, the filter was stripped and reprobed with EGFR pAb (bottom).