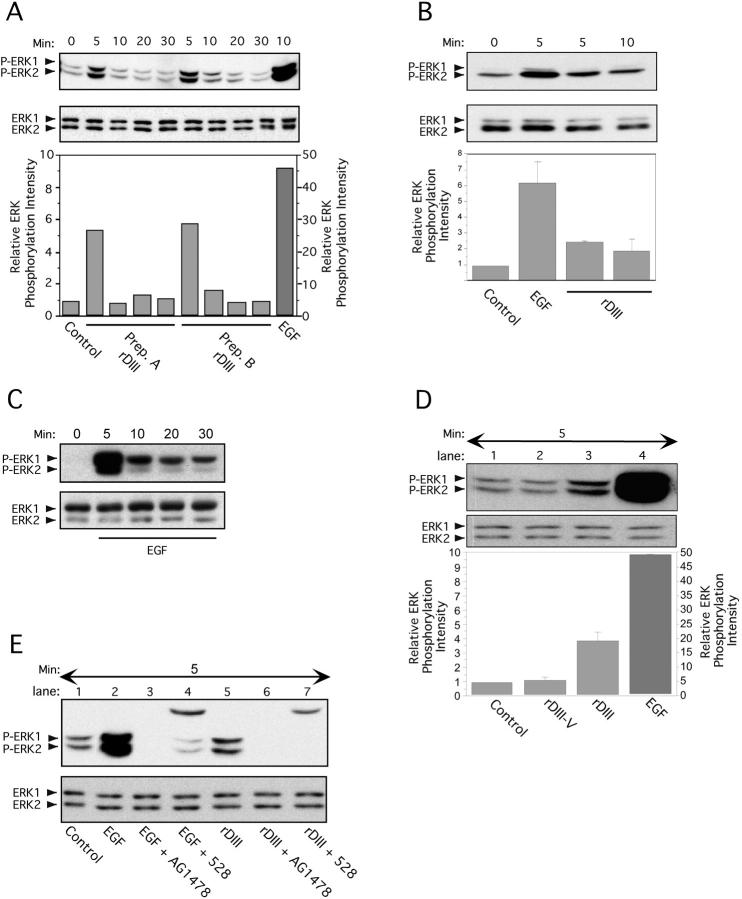
Figure 5.
Stimulation of ERK1/2 phosphorylation by rDIII. Time course of ERK1/2 activation after exposure to rDIII. Before lysate preparation, MCF-7 (A) or MDA-MB-231 (B) cells were treated with rDIII for the indicated time periods at 37°C. The ratio of phosphorylated ERK1/2 bands (P-ERK1/2, top panels) to total ERK1/2 protein bands (ERK1/2, bottom panels) was quantified. The control signal (no ligand) was set to 1 and the relative ERK phosphorylation intensity calculated and depicted as bar graphs (bottom panels). (A) ERK phosphorylation was performed with two distinct, purified preparations of rDIII protein (Prep. A and Prep. B). (B) One representative experiment and the mean ± SD (n = 3) of relative ERK1/2 phosphorylation intensity is depicted. ERK1/2 activation induced by EGF (C) but not by control protein rDIII-V (D). MCF-7 cells were stimulated with EGF (C) for up to 30 min or with rDIII, rDIII-V or EGF for 5 min and phosphorylated ERK1/2 were detected as described in the legend to A. As compared with rDIII (lane 3, D) and EGF (lane 4, D,) no phosphorylation signal above control level (lane 1, D) was seen with rDIII-V (lane 2, D). (E) Dependency of ERK1/2 activation on EGFR. Before stimulation for 5 min with either rDIII (lane 5) or EGF (lane 2), MCF-7 cells were preincubated with either AG1478 or 528. Both EGFR inhibitors diminish phosphorylation of ERK1/2 (top panel) by rDIII (lanes 6 and 7) or EGF (lanes 3 and 4). The top bands (∼25 kD) in lane 4 (EGF + 528) and 7 (rDIII + 528) originates from the IgG light chain of 528. The total amount of loaded ERK1/2 protein is shown in the bottom panel.

