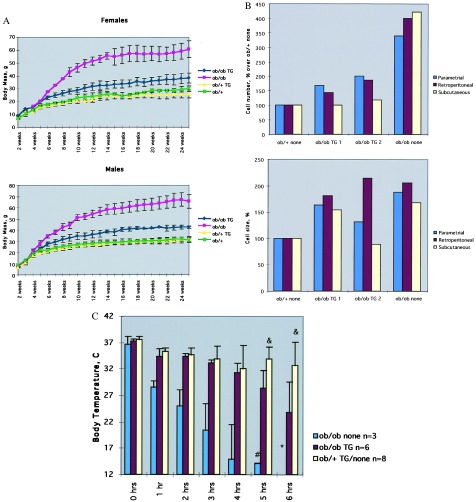
Figure 2.
Phenotype of ob/ob TG mice. (A) The body weight of the ob/ob TG, ob/+ TG, and ob/+ mice was measured every week. At all times past 4 weeks, ob/ob TG mice were significantly larger that the wild-type mice though not as heavy as ob/ob mice. All animals were fed a standard chow diet. Data for males and females are shown. (B) The adipocyte cell size was equivalent in the ob/ob TG and ob/ob mice but larger than that of wild-type mice. In contrast, the adipocyte cell number was increased ≈2.5-fold in the ob/ob mice. Thus the ob/ob TG have a hypertrophic form of obesity. (C) The response to an ambient temperature of 4°C was compared among the four groups. In contrast to wild-type mice, which maintain a normal core temperature, the ob/ob TG mice became hypothermic after 6 hr at 4°C. The ob/ob mice became hypothermic after 2 hr.

