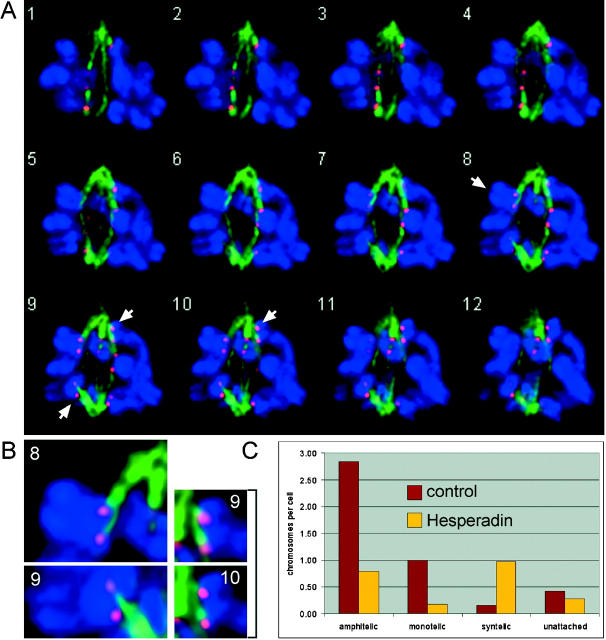
Figure 7.
Hesperadin-treated PtK cells show a higher frequency of syntelic attachments during prometaphase than control-treated cells. (A and B) PtK1 cell treated with 500 nM Hesperadin for 3 h. Deconvolved images taken at 0.2-μm Z-interval. α-Tubulin (green), CREST (red), and DNA staining (blue). Chromosomes that are attached in a syntelic manner are marked by arrows and are enlarged in B. (C) PtK2 cells were treated with 500 nM Hesperadin or 0.1% DMSO (control) for 3 h. Deconvolution microscopy was performed as in A, and the type of attachment was determined for as many chromosomes as possible (control: 26 cells, 115 chromosomes; Hesperadin: 29 cells, 64 chromosomes; see Fig. S3, available at http://www.jcb.org/cgi/content/full/jcb.200208092/DC1). The average number of chromosomes per cell exhibiting a certain type of attachment is shown.

