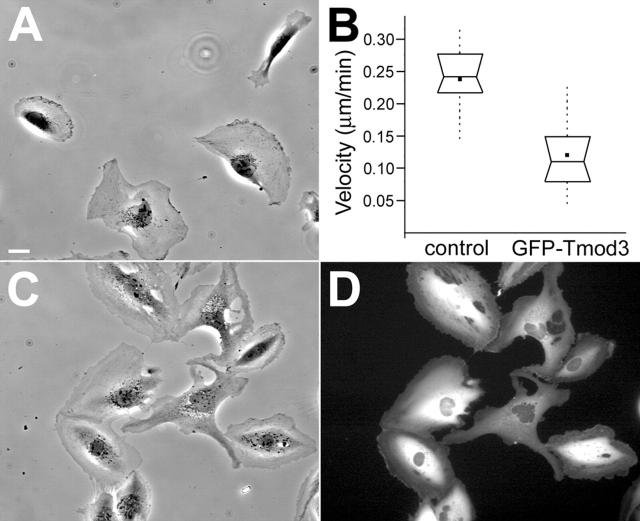
Figure 4.
HMEC-1 cell morphology and migration rate are altered by transient overexpression of GFP–Tmod3. Stills of supplemental videos (available at http://www.jcb.org/cgi/content/full/jcb.200209057/DC1) of control cells (A, Video 2) or GFP–Tmod3 cells (C and D, Video 3). Bar, 10 μm. (B) Graph of average cell migration rate of control-infected or GFP–Tmod3-overexpressing HMEC-1 cells. Box and whisker plots were generated as described in the Materials and methods. n ≥ 22 cells for each measurement.

