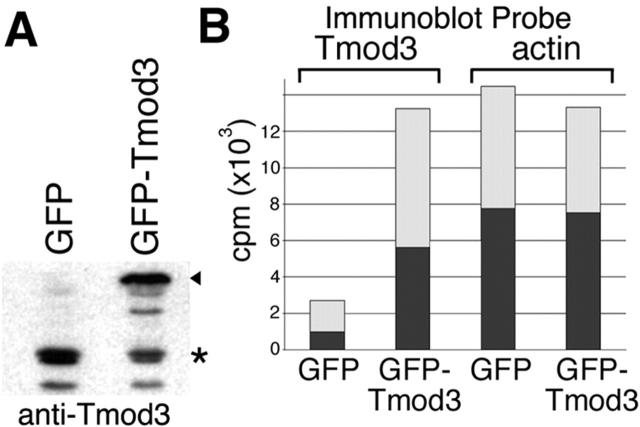
Figure 6.
Overexpression of GFP–Tmod3 and fractionation of HMEC-1 cells. (A) Immunoblot of total cell lysate of cells transiently expressing either GFP or GFP–Tmod. For both endogenous Tmod3 and GFP–Tmod3, some proteolysis was observed. When GFP–Tmod is overexpressed, an apparent decrease in the endogenous Tmod3 is observed, but overall levels of Tmod3 are increased approximately sixfold. (B) Representative experiment showing [125I]protein A–probed immunoblot quantitation of Tmod3 and actin in cells overexpressing GFP or GFP–Tmod3. cpm, 125I counts per minute (detection of anti-Tmod3 anti-actin antibodies). Dark bars, Triton-insoluble fraction; light bars, Triton-soluble fraction. For GFP–Tmod3 cells, data shown are the total of both GFP–Tmod (arrowhead) and endogenous Tmod (*) bands in a given fraction.

