
Figure 1.
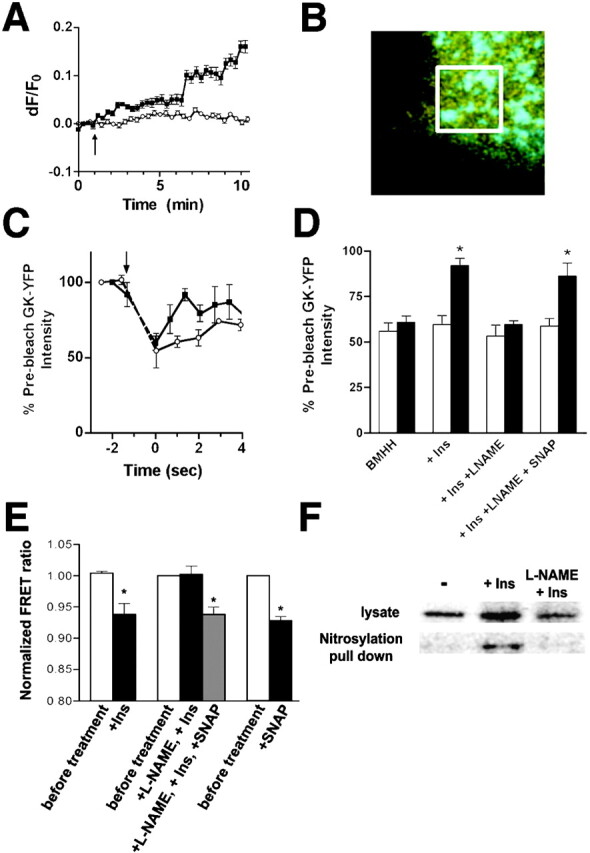
Regulation of GK by insulin requires NO. (A) βTC3 cells were starved for 4 h before loading with DAF-FM and analysis using confocal microscopy. The change in DAF intensity is represented as the change in fluorescence/initial fluorescence (dF/F0) from the average of at least 10 cells treated with 100 nM insulin (indicated by the arrow, ▪) or left untreated (○). (B) FRAP measurements were taken in cells expressing GK-YFP (yellow) and proinsulin-CFP (cyan) by selectively photobleaching YFP fluorescence in a small region (white box) of the cell containing several granules. (C) Fluorescence recovery of GK-YFP to CFP-labeled insulin granules was measured after photobleaching GK-YFP in starved cells (○) and after insulin treatment (100 nM, 5 min, ▪). The bleaching period is indicated by the arrow and broken lines. (D) FRAP measurements show fluorescence intensity of granule-associated GK-YFP immediately after photobleaching (white bars) and 2 s after photobleaching (black bars) and expressed as the percentage of prebleached fluorescence intensity. Cells were starved previously in BMHH for 3 h before insulin treatment (5 min), pretreatment with L-NAME (5 mM, 10 min) before insulin treatment (100 nM, 5 min), and after treatment with SNAP (100 μM, 1 min). Statistical significance from initial postbleach intensity (P < 0.05, t test) is denoted by an asterisk. (E) Cells expressing CFP-GK-YFP were examined for FRET by fluorescence microscopy as indicated. Statistical significance (P < 0.05 by ANOVA or t test as appropriate) is denoted by an asterisk. Cells were treated under the same conditions as in D. (F) Nitrosylated proteins were precipitated with neutravidin-agarose after biotinylation of S-nitrosylated proteins from cell lysates. Cells were treated as above where indicated. GK was detected in unreacted lysates and precipitated fractions by Western blot using an antibody to GK (Jetton and Magnuson, 1992).