Figure 5.
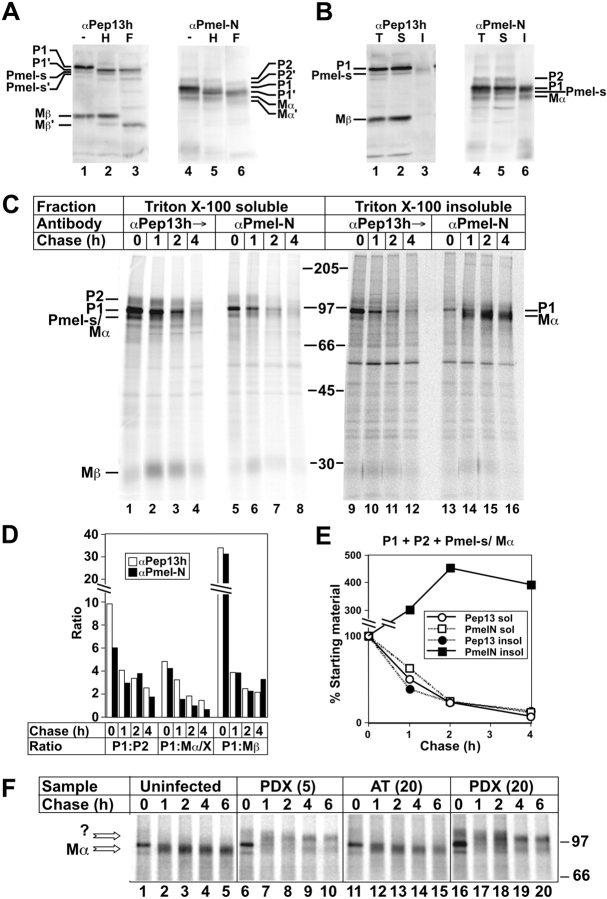
Mα accumulation in TX- insoluble fractions of MNT-1 cells and inhibition by α1-PDX. (A and B) Western blot analyses of MNT-1 cell fractions. Lysates fractionated by SDS-PAGE were probed with antibodies αPep13h (to COOH terminus) or αPmel-N (to NH2 terminus). (A) Whole-cell lysates were untreated or treated with endoH (H) or N-glycanase F (F). (B) Whole-cell lysates (T) and TX-soluble (S) or -insoluble (I) material were analyzed directly. Relevant bands are indicated; bands annotated with ′ are glycosidase cleavage products. (C–F) Pulse-chase/immunoprecipitation analyses of Mα formation in MNT-1 cells. Metabolically pulse-labeled and chased MNT-1 cells were extracted with TX, and TX-insoluble pellets were re-extracted in lysis buffer containing 8M urea at 60°C. TX-soluble and -insoluble/urea extracted fractions (after dilution of the urea) were sequentially immunoprecipitated first with normal rabbit serum, then with αPEP13h, and finally with αPmel-N. Immunoprecipitates were fractionated by SDS-PAGE and analyzed by phosphorimaging. Chase times (h) are indicated at top (C and F) or bottom (D and E); migration of molecular weight markers and relevant bands are indicated to the side. (C) αPep13h and αPmel-N immunoprecipitates from both fractions are shown. Panels on the right were exposed 22× longer than those on the left because of vastly reduced efficiency of immunoprecipitation after treatment of lysates with urea (unpublished data). Note the appearance of Mα in αPmel-N immunoprecipitates at later time points. (D) The intensity of indicated bands in each lane from the soluble fraction of C was quantitated by phosphorimaging, and ratios of the intensities of P1 to P2, Pmel17-s/Mα (Mα/X), and Mβ at each time point, precipitated by either αPep13h or αPmel-N, were calculated and plotted; the Pmel17-s and Mα bands were summed because they could not be easily resolved. Note that for each time point, ratios were similar for both antibodies. (E) Intensities of P1, P2, Pmel17-s, and Mα bands were summed at each time point for both antibodies in both soluble (sol) and insoluble (insol) fractions, and plotted as a percentage of the value at time 0. Note the loss of material from all fraction/antibody combinations except the insoluble fraction precipitated with αPmel-N, in which intensity increased over time. (F) Cells were uninfected or infected with recombinant adenoviruses expressing α1-PDX at moi of 5, PDX(5); or 20, PDX(20); or α1-AT at moi of 20, AT(20), before the experiment; shown are only the relevant regions of the αPmel-N immunoprecipitates from the TX insoluble fraction. Arrows, bands that co-migrate with Mα or a novel product (?) precipitated only from cells expressing α1-PDX.

