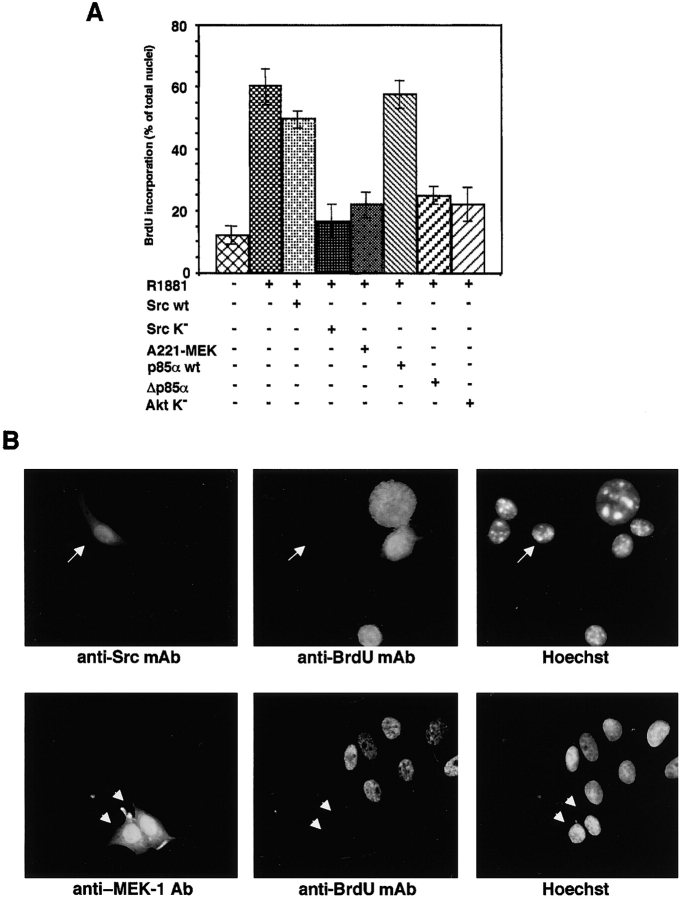
Figure 2.

Requirement for the Src–ERK and PI3-kinase–Akt pathways in the androgen-stimulated S-phase entry is correlated to AR–Src–PI3-kinase association in NIH3T3 cells. Fibroblasts on coverslips were either untransfected or transfected with the plasmids expressing the indicated proteins. (A) Transfected cells were made quiescent, and then left unstimulated or stimulated with 0.001 nM R1881. BrdU was added and coverslips were analyzed for BrdU incorporation. In transfected cells, BrdU incorporation was calculated by the formula: percentage of BrdU-positive cells = (number of transfected BrdU-positive cells/number of transfected cells) × 100 and compared with BrdU incorporation of untransfected cells from the same coverslips. For each plasmid, data are derived from at least 200 scored cells. The results of more than two independent experiments have been averaged; means and SEM are shown. The statistical significance of these results was also evaluated by paired t test. P values were <0.001 for cells transfected with either Src K−, Δp85α, Akt K−, or A221–MEK-1. The difference in BrdU incorporation between the cells transfected with Src K− and those transfected with Src wt was significant (P < 0.005). Also significant (P < 0.001) was the difference in BrdU incorporation between the cells transfected with Δp85α and those transfected with p85α wt. No significance was attributed to the difference in BrdU incorporation between the cells transfected with either Src wt or p85α wt and nontransfected cells stimulated with the androgen R1881. (B) Representative images of one of the experiments in A. Fluorescence in the left panels is from reactivity with either the anti-Src mAb (top) or the anti–MEK-1 Ab (bottom). Arrows and arrowheads mark the cells transfected with either Src K− or A221–MEK-1 expressing plasmids. The central panels show staining with anti-BrdU antibody. Hoechst 33258 nuclear staining is presented in the right panels. Quiescent NIH3T3 cells were either left untreated or treated for 2 min with the indicated compounds. (C) Lysate proteins were immunoprecipitated with either control antibody (ctrl) or the 327 anti-Src monoclonal antibody (anti-Src mAb). (D) Lysate proteins were immunoprecipitated with either control antibody (ctrl) or rabbit polyclonal anti-p85 antibody (anti-p85 Ab). (C and D) Immunocomplexes were analyzed by immunoblot with antibodies against the indicated proteins. (D) By an NIH 1.61 image program, a 38% increase of AR/p85 association was detected on 0.001 nM R1881 stimulation of cells. This experiment was reproduced with similar findings. (E) Lysate proteins from NIH3T3 cells challenged for 2 min with the indicated compounds were immunoblotted with the C-19 anti-AR antibody.

