
Figure 6.
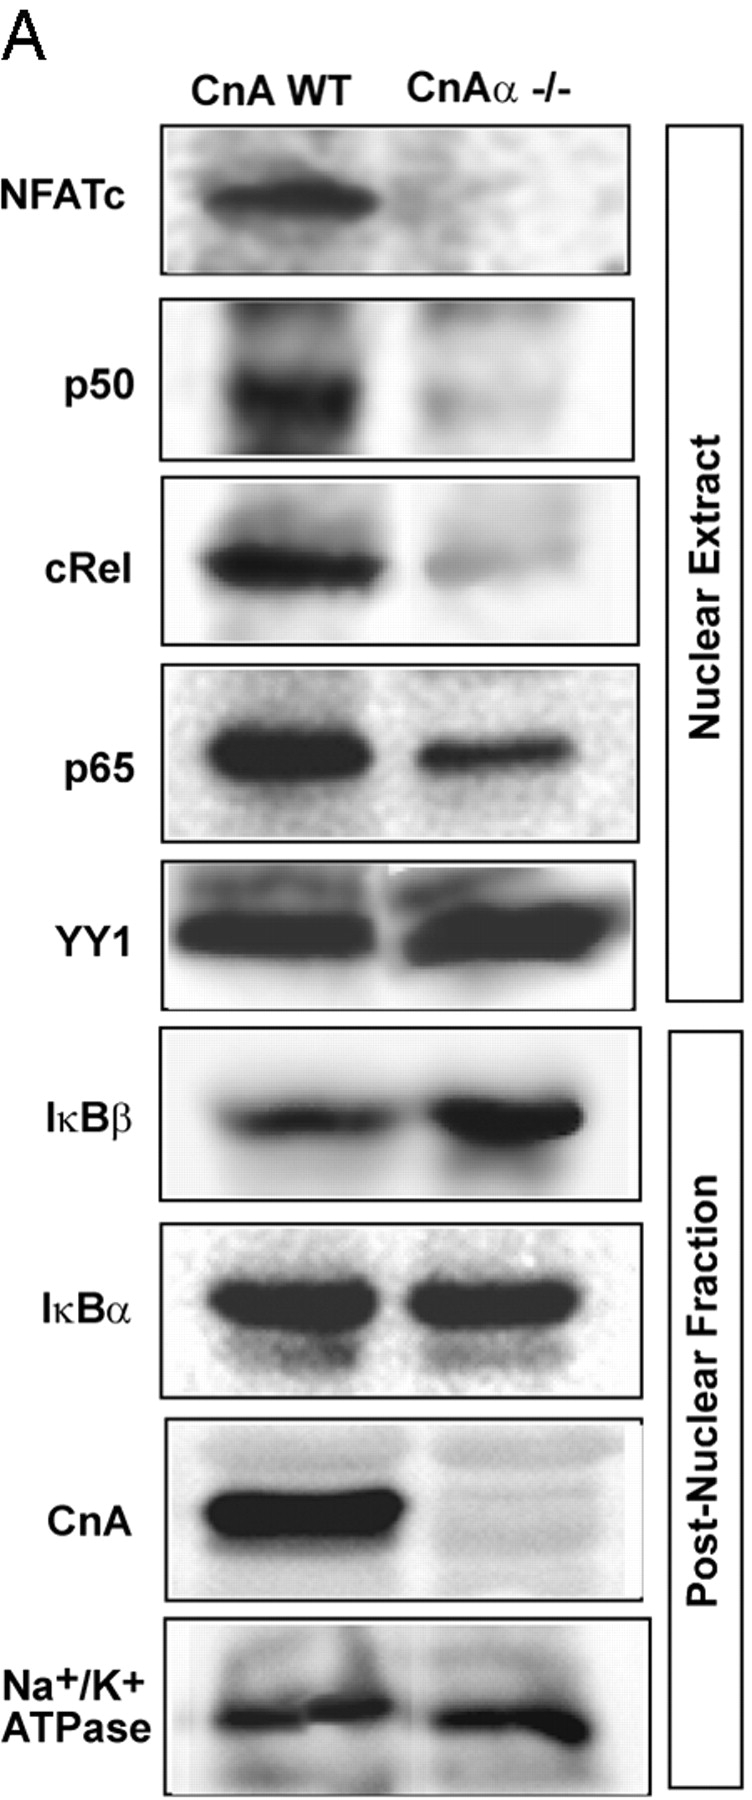

Levels of mitochondrial stress–induced NFκB pathway proteins in CnAα− / − muscle and cells treated with Ca 2+ chelators. (A) The nuclear and postnuclear fractions (25 μg protein each) of skeletal muscle tissues from wild-type and CnAα−/− mice were analyzed by immunoblot analysis with the indicated antibodies. Other details are as in the legend to Fig. 1 and as described in Materials and methods. (B) Control and mtDNA-depleted C2C12 cells treated with or without EGTA/AM and FK506 were fractionated, and postnuclear fractions were subjected to immunoblot analysis with the indicated antibodies. Values in the parentheses in B indicate relative band intensities.