
Figure 8.
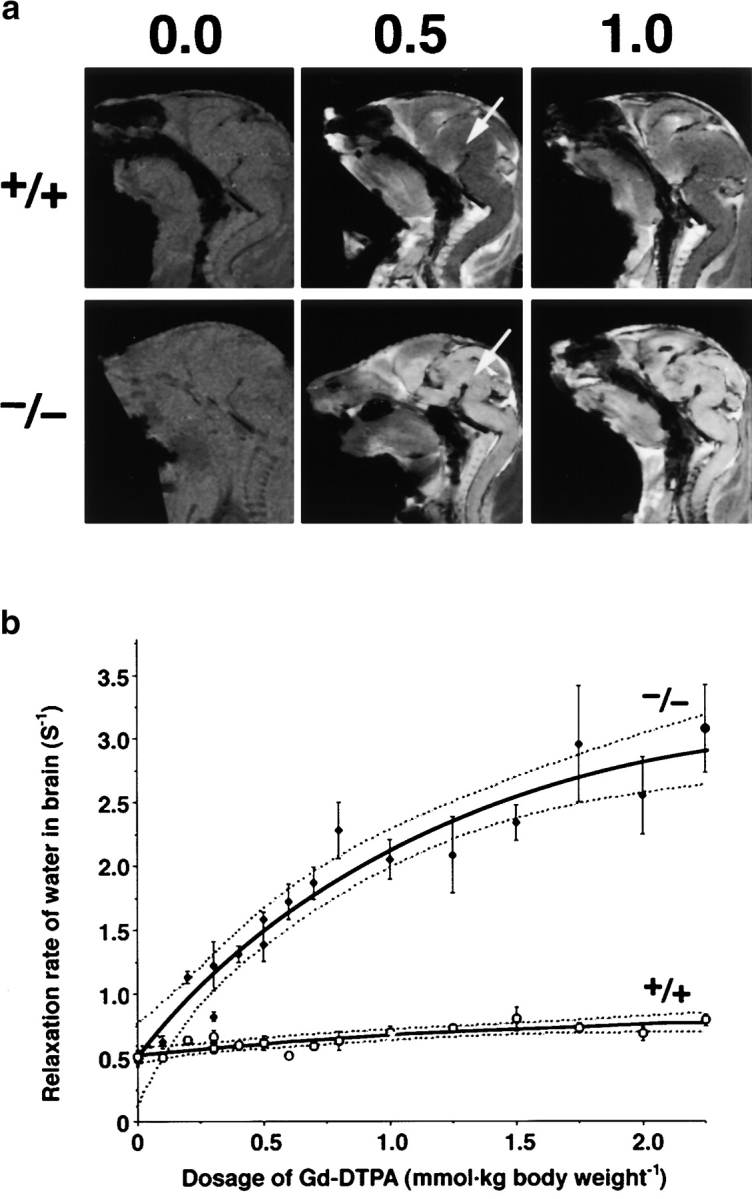
MRI of 18.5-d embryos. (a) Mid-sagittal T1-weighted images of the wild-type and Cld5 −/− brain after the transcardial injection of Gd-DTPA (0.0, 0.5, and 1.0 mmol/kg body wt). Due to shortening of the T1 relaxation time, the Gd-DTPA–accessible area was represented as a high signal intensity. In the wild-type mice, Gd-DTPA did not enter the extravascular space in the CNS, so the brain parenchyma (top middle, arrow) maintained a constant image intensity even at a high dose of Gd-DTPA. By contrast, in the Cld5 −/− brain, the image intensity in all areas of the CNS (bottom middle, arrow), including the spinal cord, was enhanced by Gd-DTPA, and the degree of enhancement depends on the dosage of injected Gd-DTPA. (b) The relationship between the relaxation rate of water (1/T1) in the brain and the dosage of injected Gd-DTPA. As 1/T1 of the brain, 1/T1 values of the five ROIs (156 × 156 × 750 mm) including the cortex, thalamus, hypothalamus, cerebellum, and pons were averaged. The bold and dotted lines are the results of fitting and 95% confidence limits, respectively. As explained in the text, on the assumption of a simple two-compartment exchange model (Fabry and Eisenstadt, 1978; Schwarzbauer et al., 1997), this relationship allowed us to estimate quantitatively the Gd-DTPA–accessible space per unit volume of the brain.