
Figure 1.
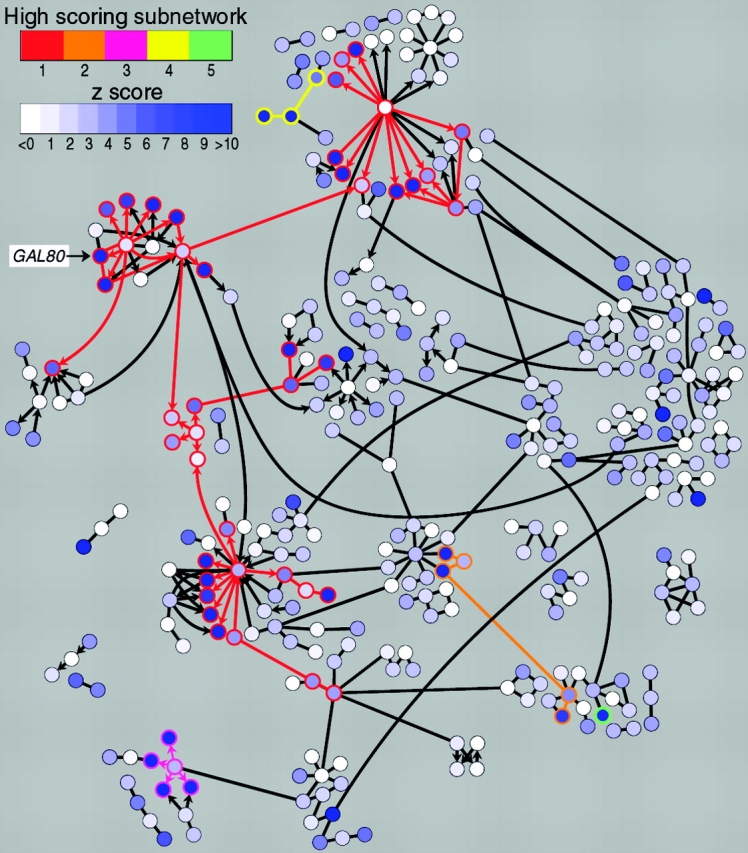
Identification of regulatory pathways using network graphing and simulated annealing methods. Shown is the network of interacting molecules implicated in galactose utilization in yeast. Each node (gene/protein) is colored based on the significance of its expression change (z-score) in an experiment comparing mRNA levels in a wild-type strain and a gal80 mutant. Higher z-scores indicate higher significance of change, either up or down. Simulated annealing methods were used to identify subnetworks (indicated by colored node borders and edges) with high aggregate z-scores. Note that the GAL module, including GAL80, is part of a high-scoring subnetwork. This figure was reprinted from Ideker et al., Discovering regulatory signalling circuits in molecular interaction networks, Bioinformatics, 2002, Vol. 18, pg. S233–S240 by permission of Oxford University Press.