
Figure 1.
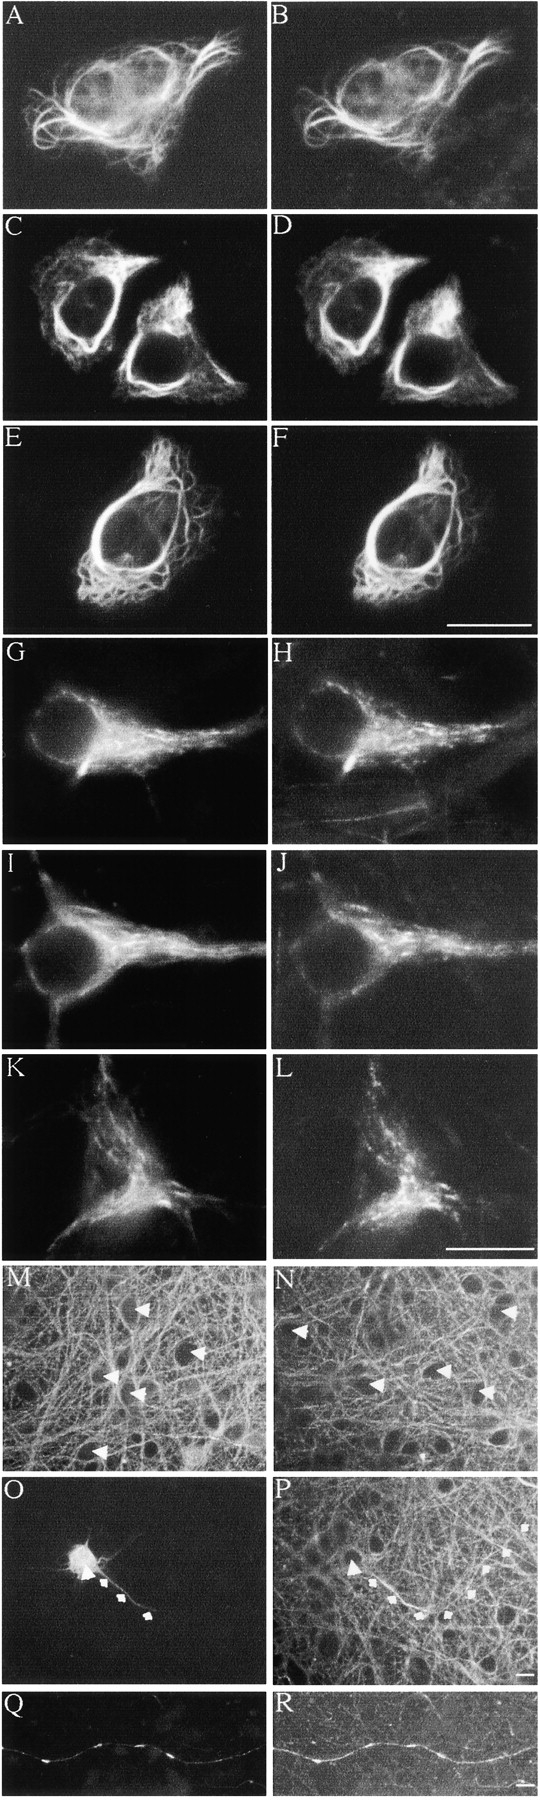
GFP–NFH assembly and phosphorylation mimics that of endogenous NFH. (A–F) SW13− cells transfected with NFL + NFM + NFH + either GFP–NFHwt (A and B), GFP–NFHala (C and D), or GFP–NFHasp (E and F). (G–L) Cortical neurons transfected with GFP–NFHwt (G and H), GFP–NFHala (I and J), or GFP–NFHasp (K and L). GFP–NFH was detected via the GFP tag in A, C, E, G, I, and K. NFL was detected using antibody NR4 in B, D, F, H, J, and L. A–L were visualized 16 h after transfection, but similar images of cortical neurons were obtained at earlier (140–260 min) and later (48 h) times. (M and N) Cortical neurons stained with antibodies 8D8 (M) and RT97 (N); unstained cell bodies are arrowed. (O–R) Cortical neurons transfected with GFP–NFHwt and costained with RT97. O and P are visualized 200 min after transfection, and Q and R are visualized 48 h after transfection. O and Q show GFP–NFHwt via the GFP tag; P and R show RT97 labeling. Large arrow shows cell body, and small arrows show trace axon of a transfected cell. Note the increased RT97 labeling in regions of axons where GFP–NFHwt is present, but also note the absence of RT97 labeling in cell bodies. Bars, 20 μm.