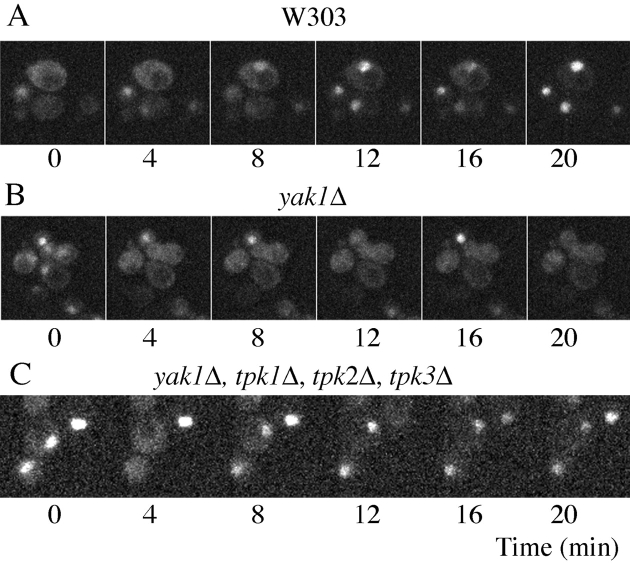
Figure 5.
Oscillatory behavior of Msn4–GFP. Msn4–GFP behavior is shown in W303 cells (A), in yak1Δ cells (B), and in yak1Δ, tpk1Δ, tpk2Δ, tpk3Δ cells (C). Only the images taken at 4-min intervals are presented (see Video 3, available at http://www.jcb.org/cgi/content/full/jcb.200303030/DC1).

