Figure 6.
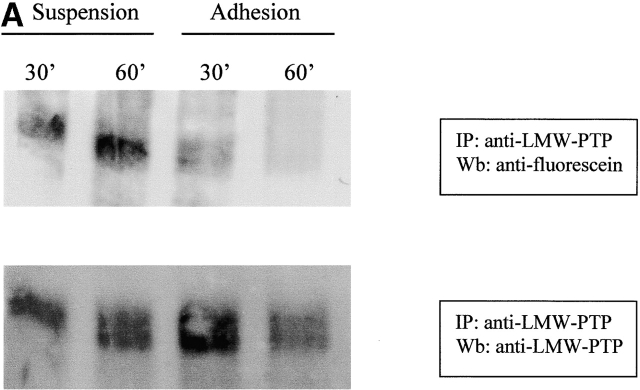
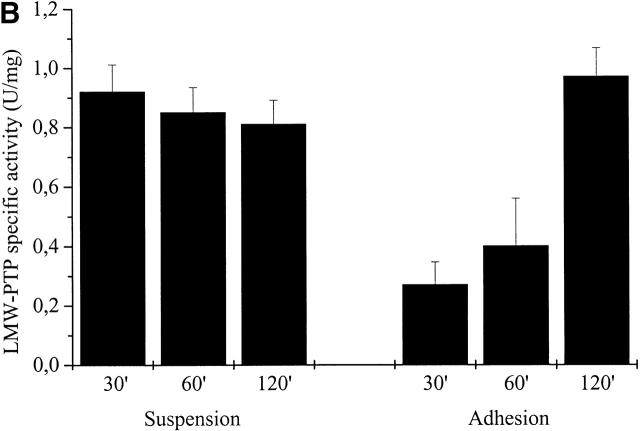
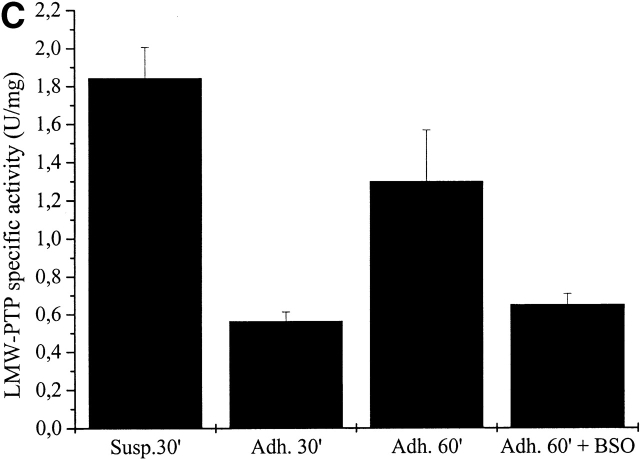
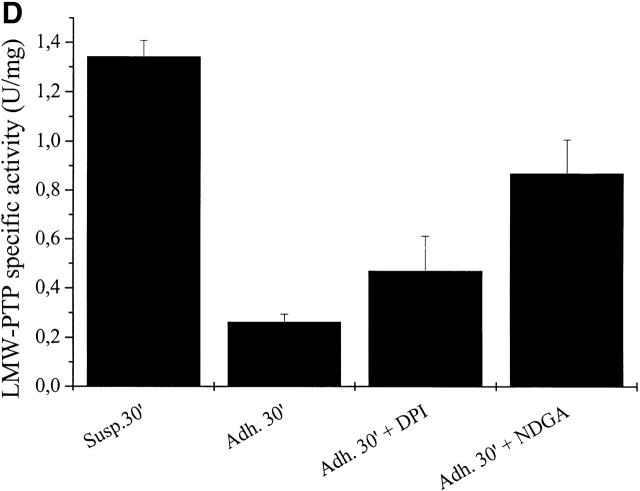
LMW-PTP oxidation during cell adhesion. (A) 106 NIH-3T3 cells were serum starved for 24 h before detaching and maintained in suspension for 30 min at 37°. Cells were then kept in suspension or seeded onto fibronectin-treated dishes for 30 and 60 min. Cells were then lysed in RIPA buffer and treated with 5′-F-IAA. LMW-PTP was immunoprecipitated, and an antifluorescein immunoblotting was performed. The blot was then stripped and reprobed with anti–LMW-PTP antibodies for normalization. (B) 106 NIH-3T3 cells overexpressing wtLMW-PTP were treated as in A except that LMW-PTP was immunoprecipitated without 5′-IAF labeling, and a PTP activity assay was performed using PNPP as substrate. LMW-PTP activity is shown in U/mg. (C) 106 NIH-3T3 cells overexpressing wtLMW-PTP were treated as in B except that they were pretreated for 16 h with or without BSO in order to inhibit the synthesis of glutathione. (D) 106 NIH-3T3 cells overexpressing wtLMW-PTP were treated as in B except that they were pretreated for 30 min with or without 5 μM DPI or 10 μM NDGA in order to inhibit the synthesis of ROS. These data are representative of at least three independent experiments.


