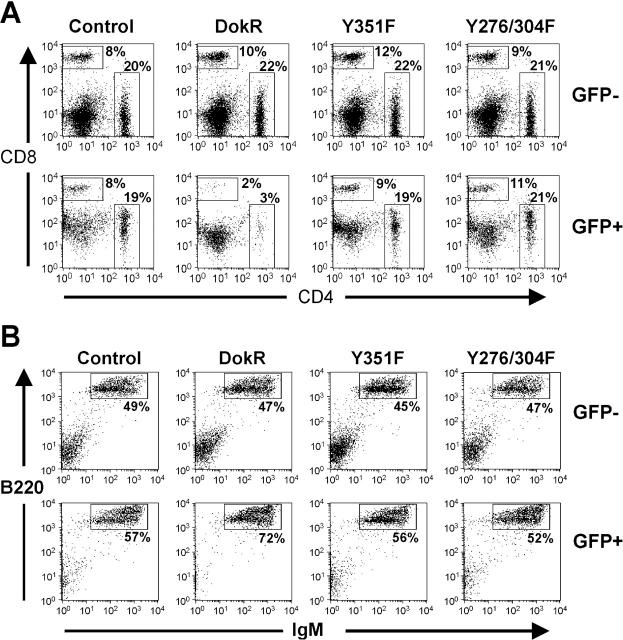
Figure 6.
Constitutive expression of DokR suppresses production of mature T cells but not mature B cells. (A) Flow cytometric analysis showing the percentage of GFP− (top) and GFP+ (bottom) splenocytes expressing CD4 and CD8. The results shown are representative of data obtained from 7 to 13 mice per experimental group. (B) Flow cytometric analysis showing the expression of IgM and B220 on GFP− (top) and GFP+ (bottom) splenocytes from reconstituted mice. The percentages of GFP− and GFP+ B lymphocytes (IgM+B220+ cells) are indicated. Note that because of compensation for the high levels of fluorescence emitted by the GFP+ (B220+IgM+) B cells, the DN (B220−IgM−) population (bottom left) was partially obscured. Dot plots shown are representative of data pertaining to 7–13 mice per experimental group.

