
Figure 2.
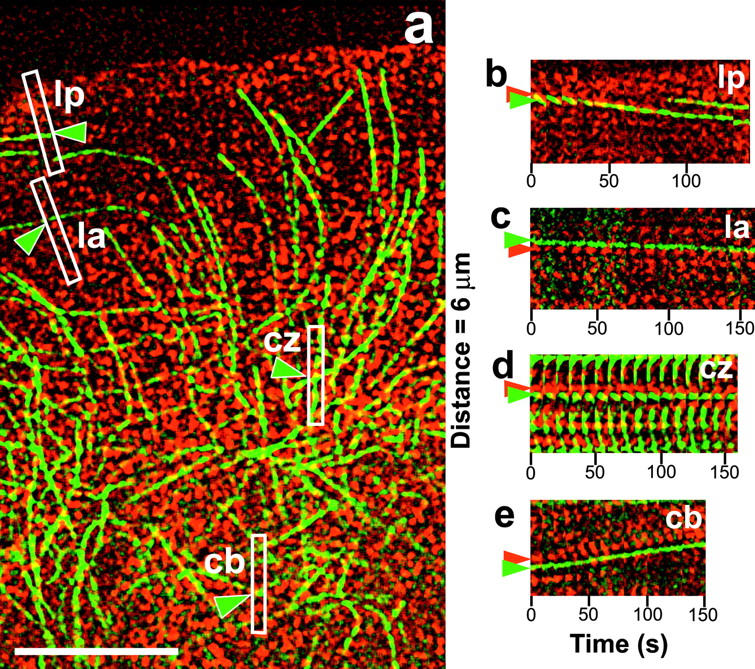
MTs parallel to the leading edge are coupled to the movement of f-actin. (a) Image from Video 3 (available at http://www.jcb.org/cgi/content/full/jcb.200203022/DC1) of Cy2 MTs (green) and X-rhodamine f-actin (red). Boxes highlight the regions in the lamellipodium (lp), lamellum (la), convergence zone (cz), and cell body (cb) that were used to construct the kymographs in (b–e). The long axis of the boxes was tilted to match the trajectory of speckles as determined by watching Video 3. Green arrowheads highlight the parallel MTs being analyzed. (b–e) Dual wavelength kymographs of the regions highlighted in panel a. Green and red arrowheads highlight speckles in parallel MTs and the actin meshwork, respectively. Bar, 10 μm.