
Figure 4.
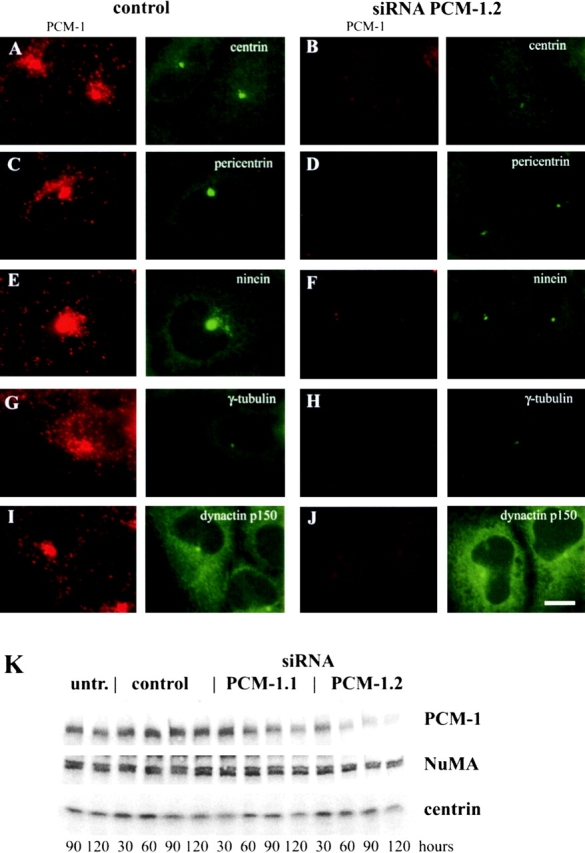
Depletion of PCM-1 by RNA silencing reduces centrosomal localization of centrin, pericentrin, and ninein, but not γ-tubulin or dynactin. A–J show U-2 OS cells treated with control or PCM-1 siRNA oligonucleotides, as indicated. Image pairs show cells double stained for (A and B) PCM-1 and centrin, (C and D) PCM-1 and pericentrin, (E and F) PCM-1 and ninein, (G and H) PCM-1 and γ-tubulin, and (I and J) PCM-1 and dynactin p150/glued. The amount of centrosomal protein localization after PCM-1 depletion was determined by photometric analysis to be 39% of centrin (± 17), 36% of pericentrin (± 21), 38% of ninein (± 20), 99% of γ-tubulin (± 58), and 82% of dynactin (± 37), as compared with control cells (n = 34 cells/each). (K) Immunoblots of extracts from untreated cells (untr.), and cells treated with control RNA oligomers siRNA PCM-1.1 or siRNA PCM-1.2, for different lengths of time as indicated. Blots were probed with antibodies against PCM-1, NuMA ,and centrin-3. Bar (J), 10 μm.