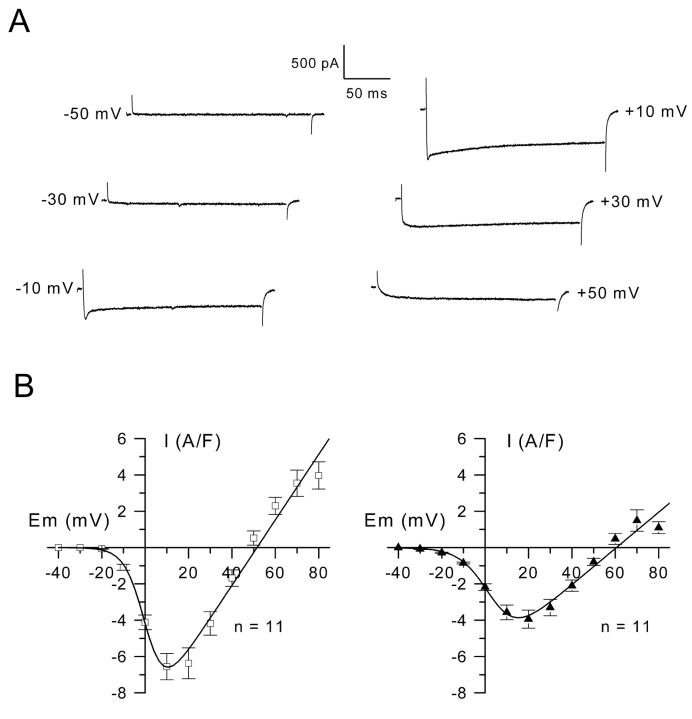
Figure 2.
Inward currents and mean current-voltage relationships. (A) Inward currents were evoked on the same cell by voltage pulses in the presence of K+ channel blockers from a holding potential of –70 mV to the indicated values. (B) Mean current-voltage relationships were established at the peak of the currents (left) and at the end of the depolarization pulses (right). The curves were fitted by using Eq. 1 (see Experimental procedures) with values for G max, V rev, V 0.5, and k of 180 S/F, +51 mV, 0.9 mV, and 4.6 mV (left) and of 100 S/F, +60 mV, 3.6 mV, and 6.6 mV (right).

