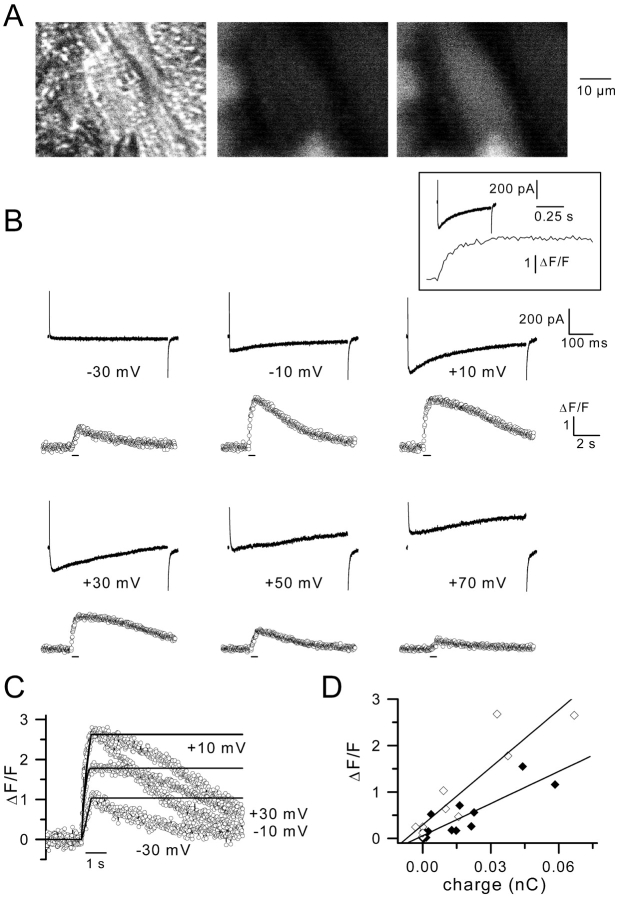
Figure 6.
Ca2 + transients and Ca2 + currents in voltage-clamped cells. (A) The light micrograph in the left panel shows a muscle cell with a recording pipette sealed. The two other panels show the fluorescence images of the same field before (middle) and during a voltage pulse given to +10 mV (right). (B) The same cell was depolarized by 500 ms duration pulses from a holding potential of –70 mV to the indicated potentials. The upper and lower traces correspond to membrane currents and Ca2+ transients, respectively, on different time scales. Fluorescence was sampled at 50 Hz. Inset shows the membrane current and the Ca2+ transient obtained in response to a voltage pulse given to +10 mV on the same time scale. Bars below the fluorescence traces indicate the time during which depolarizing pulses were applied. (C) The running integral of the Ca2+ currents and the corresponding Ca2+ transients were superimposed for pulses to the indicated potentials. For each pulse, the integral of the current was normalized to the peak value of the Ca2+ transient to allow comparison of kinetics. For pulses to –10 and +10 mV, the integrals of current merge into one. (D) The amplitude of the Ca2+ transients were plotted against the integral of the corresponding Ca2+ currents for two different cells (⋄ and ♦, respectively) depolarized by 500 ms duration pulses from a holding potential of –70 mV up to +30 mV. A linear function was fitted to data points for each cell.

