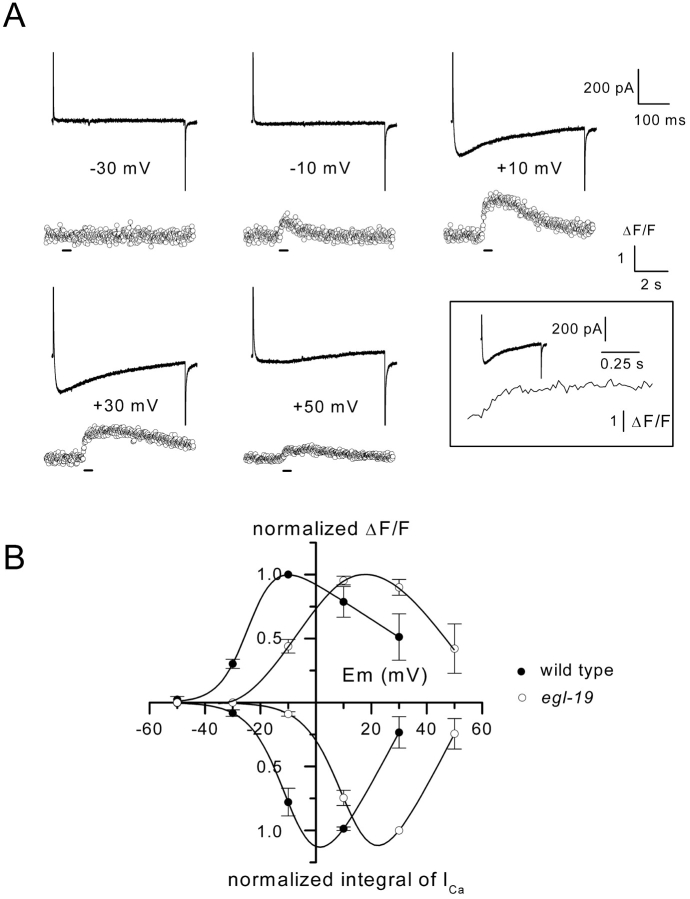
Figure 8.
Ca2 + transients and Ca2 + currents in egl-19 mutant muscle cells. (A) The cell was depolarized by 500-ms duration pulses from a holding potential of –70 mV to the indicated potentials. The upper and lower traces correspond to membrane currents and Ca2+ transients, respectively, on different time scales. Fluorescence was sampled at 50 Hz. Inset shows the membrane current and the Ca2+ transient obtained in response to a voltage pulse given to +10 mV on the same time scale. Bars below the fluorescence traces indicate the time during which depolarizing pulses were applied. (B) The mean normalized amplitude of the Ca2+ transients and the mean normalized value of the integral of the Ca2+ currents in wild-type and egl-19 muscle cells were plotted as a function of membrane potential. Data points correspond to values averaged from five series of voltage pulses applied in three egl-19 cells and four series of voltage pulses applied in two wild-type cells, respectively. Data points were normalized to the maximal mean value obtained in wild-type and egl-19 muscle cells, respectively. The curves were drawn by eyes.

