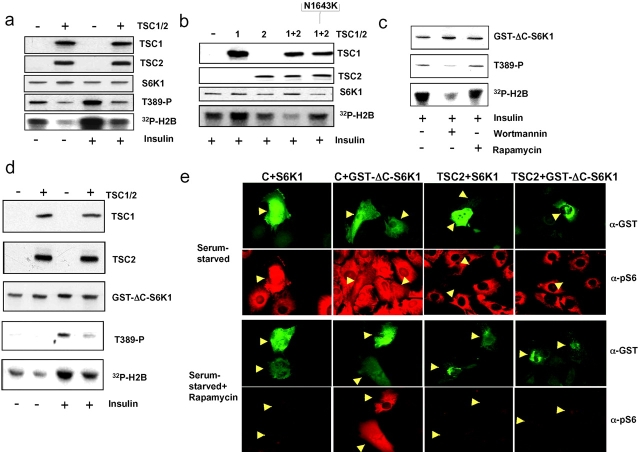
Figure 3.
The inhibitory effects of TSC1-2 on wild-type S6K1 and GST-ΔC-S6K1. (a) Cos cells were cotransfected with S6K1 and Flag-tagged TSC1 and TSC2 expression constructs, and after serum deprivation, left untreated or stimulated with 200 nM insulin for 30 min. (b) Cos cells were cotransfected with S6K1 and TSC1 alone, TSC2 alone, TSC1 and wild-type TSC2 together, or TSC1 and N1643K TSC2 mutant together. Cells were extracted after stimulation with 200 nM insulin. Expression levels of S6K1 as well as T389 phosphorylation and kinase activity were determined as in Fig. 1. TSC1 and TSC2 were detected with a Flag epitope antibody. (c) Cos cells transfected with GST–ΔC-S6K1 (Dennis et al., 2001) were stimulated with 200 nM insulin alone or in the presence of either 100 nM wortmannin or 20 nM rapamycin. (d) Cos cells were cotransfected with GST–ΔC-S6K1 together with TSC1 and -2 and stimulated with insulin (Fig. 3 a). Expression levels of TSC1 and TSC2, S6K1 phosphorylation, and activity of S6K were as in panel b. (e) TSC2−/− MEFs microinjected with pCMVTag empty control vector (C) or pCMVTag vector encoding wild-type TSC2 (TSC2) in combination with expression vectors encoding GST-tagged wild-type S6K1 (+S6K1) or GST–ΔC-S6K1 after 12 h serum starvation (Serum-starved) alone or followed by treatment with 10 nM rapamycin (Serum starved + Rapamycin). Images are of cells expressing GST-tagged kinases (α-GST, green) and S6K1 activity measured using an antibody to phospho-S6 (α-pS6, red).

