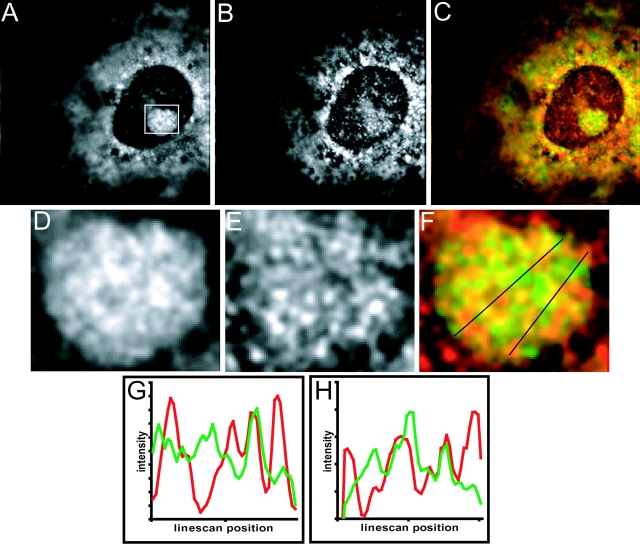
Figure 7.
SRP RNA and 28S rRNA distribution in the nucleolus revealed by double in situ hybridization. Deconvolved midplane of NRK cell containing 28S rRNA signal (A), SRP RNA signal (B), and these two images combined (C) where 28S rRNA is green and SRP RNA is red. Overlapping regions of similar intensities are shown in yellow. (D–F) Deconvolved images of nucleolus shown in boxed area in A. (D) 28S rRNA signal. (E) SRP RNA signal. (F) Color combined images of D and E coded as in the C above. (G) Linescan of leftmost line in F. (H) Linescan of rightmost line in F. Each linescan shows, from left to right, the intensities (arbitrary units) of 28S rRNA (green) and SRP RNA (red) along the line indicated in F, proceeding downward from top to bottom. Linescans are displayed with the minimal linescan intensity at the origin of the y-axis.

