
Figure 1.
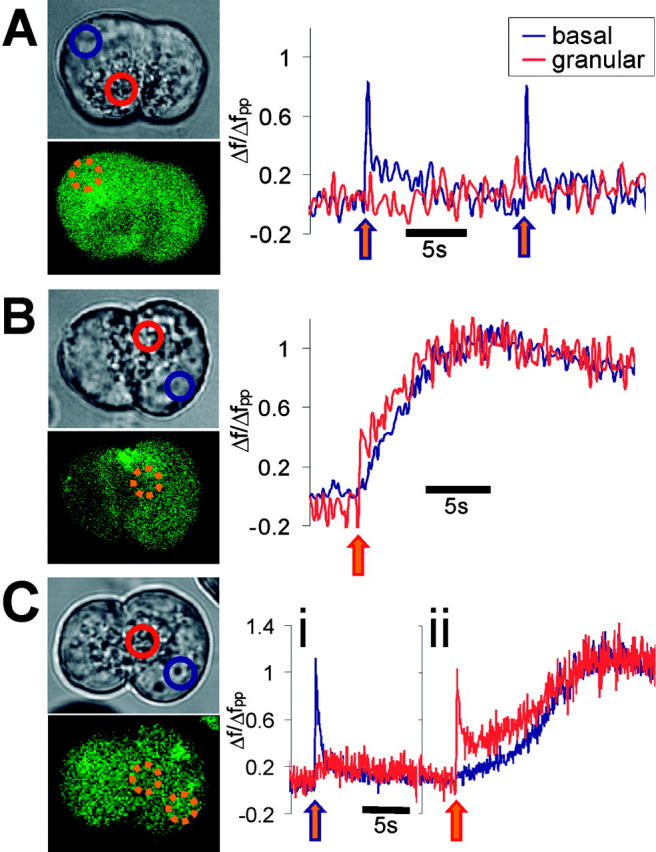
Regional variations in CICR triggered by localized uncaging. All traces represent normalized fluorescence of fluo-4 in the regions shown in accompanying transmitted image. Intracellular regions where uncaging was targeted are shown by dashed orange circles superimposed on accompanying fluorescence image. Uncaging was produced at the time points shown by arrows on the trace. The outline color of the arrow corresponds to the region of uncaging. (A) Uncaging localized to the basal region causes short-lasting, localized elevations in calcium (uncaging spikes) but fails to trigger any CICR. Fpp ratio = 1.35. (B) Uncaging of similar strength localized to the apical (secretory granule) region causes the uncaging spike that then triggers a long-lasting global CICR transient. Fpp ratio = 1.13 (C) In the same cell, (i) basal localized uncaging fails to cause CICR, but (ii) subsequent apical uncaging of identical power triggers a slowly developing global CICR transient. Fpp ratio = 1.73.