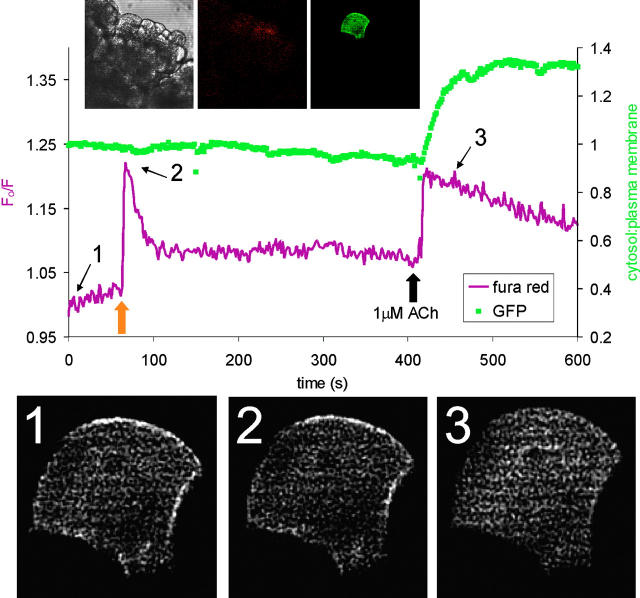
Figure 2.
Uncaging of Ca2 + does not stimulate PLC to produce IP3. Graph shows cytoplasmic Ca2+ and distribution of GFP–PHD in the pancreatic acinar cell shown in accompanying images (left to right: transmitted, fura red, GFP). Upper trace shows ratio of cytoplasmic to plasma membrane GFP fluorescence and lower trace shows normalized fura red fluorescence. Lower panel shows three images of GFP–PHD taken from time points indicated by the numbers on the graph. Strong uncaging at the point shown by the orange arrow causes a large rise in calcium but fails to trigger any change in the distribution of GFP–PHD, indicating that there is no production of IP3 after uncaging (compare images 1 and 2). In contrast, subsequent stimulation with 1 μM ACh causes a rapid translocation of GFP–PHD into the cytoplasm, indicated by the increase in cytoplasmic/plasma membrane fluorescence ratio and shown in image 3. This rise in IP3 level is accompanied by a sharp rise in intracellular calcium as calcium is released from stores, which is similar in peak value to that induced by uncaging.

