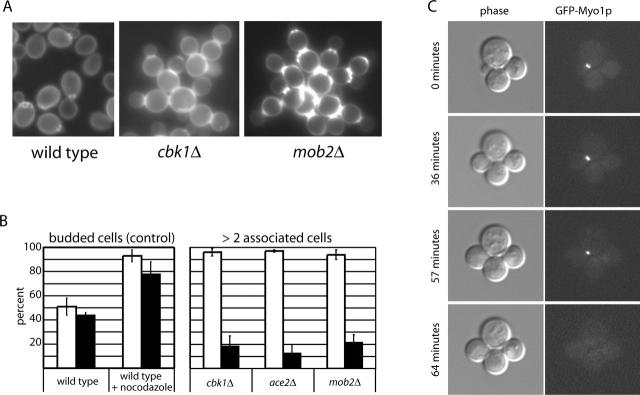
Figure 1.
Characterization of cell separation defects in mob2 Δ and cbk1 Δ cells. (A) Chitin staining of wild-type (left; FLY93), cbk1Δ (middle; FLY757), and mob2Δ (right; FLY168) cells stained with calcofluor, highlighting mother/daughter junctions and cell shape. (B) Dissociation of attached cells after cell wall digestion. In the control graph on the left, asynchronously growing and nocodazole-arrested wild-type cells were fixed and digested, and cells with one or more buds were scored as associated cells. In the right graph, digested cbk1Δ and mob2Δ cells with more than two associated cell bodies were scored as associated. In both graphs, white bars represent the fraction of associated cells before digestion, and black bars represent the fraction of associated cells after digestion. (C) Time lapse of Myo1–GFP fluorescence in a live mob2Δ cell (FLY770). Note shrinkage and disappearance of Myo1–GFP signal, corresponding with maximal enlargement of daughter bud.

