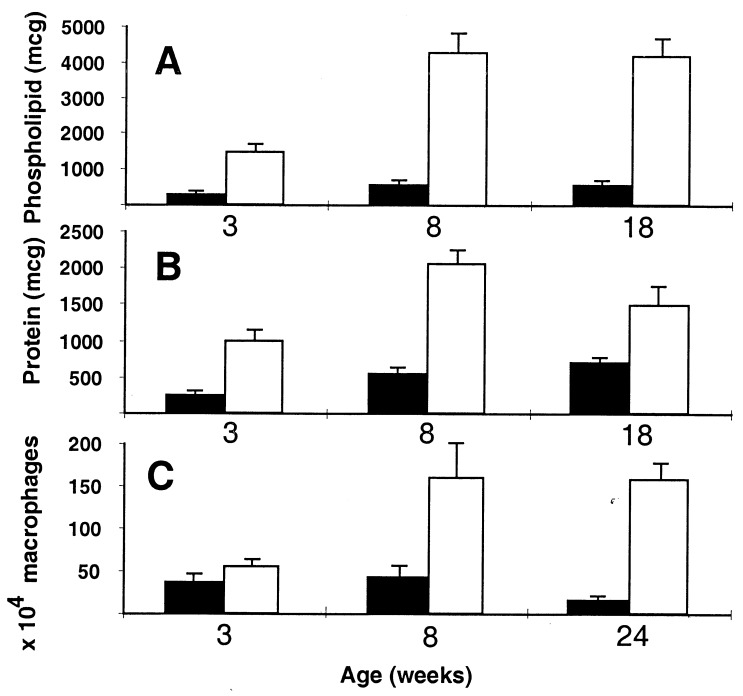
Figure 4.
BAL analysis of SP-D +/+ (solid bars) and SP-D −/− (open bars). (A) Total BAL phospholipid per mouse at 3, 8, and 18 weeks (n = 8 for each genotype at each age; P < 0.001). (B) Total BAL protein per mouse at 3, 8, and 18 weeks (n = 8 for each genotype at each age; P < 0.01). (C) Number of alveolar macrophages per mouse at 3, 8, and 24 weeks (n = 4 to 7 for each genotype at each age; P < 0.05 at 3 and 24 weeks). Error bars indicate the SEM.

