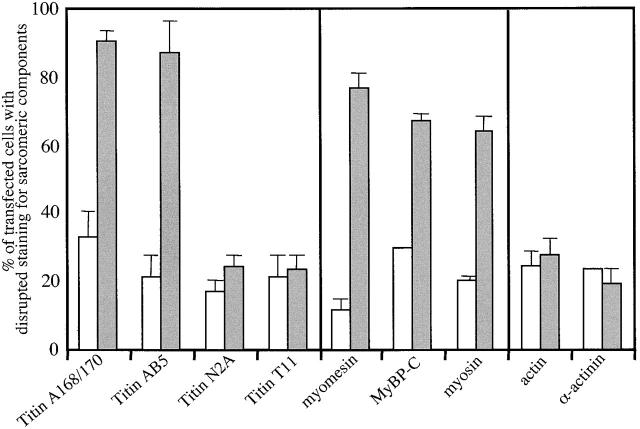
Figure 6.
Quantification of GFP–MURF-1– and GFP-expressing myocytes exhibiting disrupted staining patterns for sarcomeric components. Myocytes expressing GFP–MURF-1 (gray bars) or GFP alone (white bars) were stained for various sarcomeric components, and the number of cells exhibiting perturbed staining patterns was counted. The results indicate that the COOH-terminal region of titin (A168–170 and AB5) was severely disrupted in most GFP–MURF-1–expressing cells, whereas its I-band (N2A) and NH2-terminal region (T11) were not affected. The thick filament components myosin, myomesin, and C-protein were also disrupted in a large majority of GFP–MURF-1–expressing cells, but thin filament and Z-line components appear relatively unaffected. Data are presented as the mean percentage of total myocytes with disrupted staining ± SD. Means were obtained by counting >50 myocytes from more than two experiments and the results are representative of >10 experiments.

