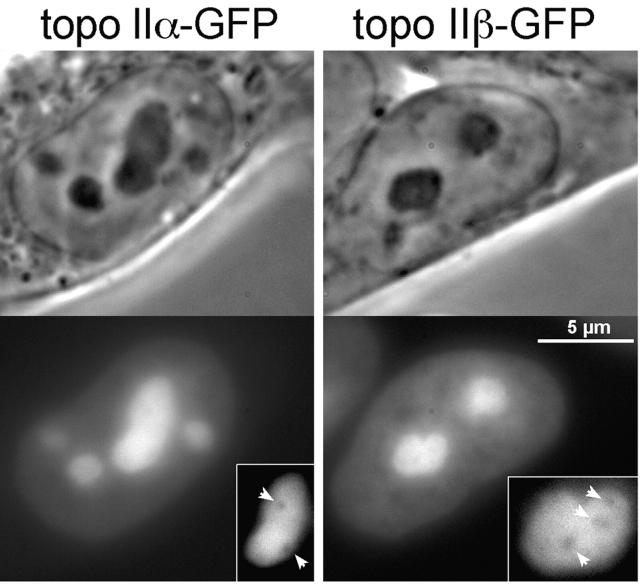
Figure 2.
Distribution of topo II–GFP in interphase nuclei. Phase-contrast images and corresponding green fluorescence of living 293 cells expressing topo IIα–GFP (left) and topo IIβ–GFP (right). The insert shows images of selected nucleoli subjected to twofold magnification and contrast enhancement. Arrowheads indicate areas of decreased fluorescence intensity within the nucleoli.

