
Figure 5.
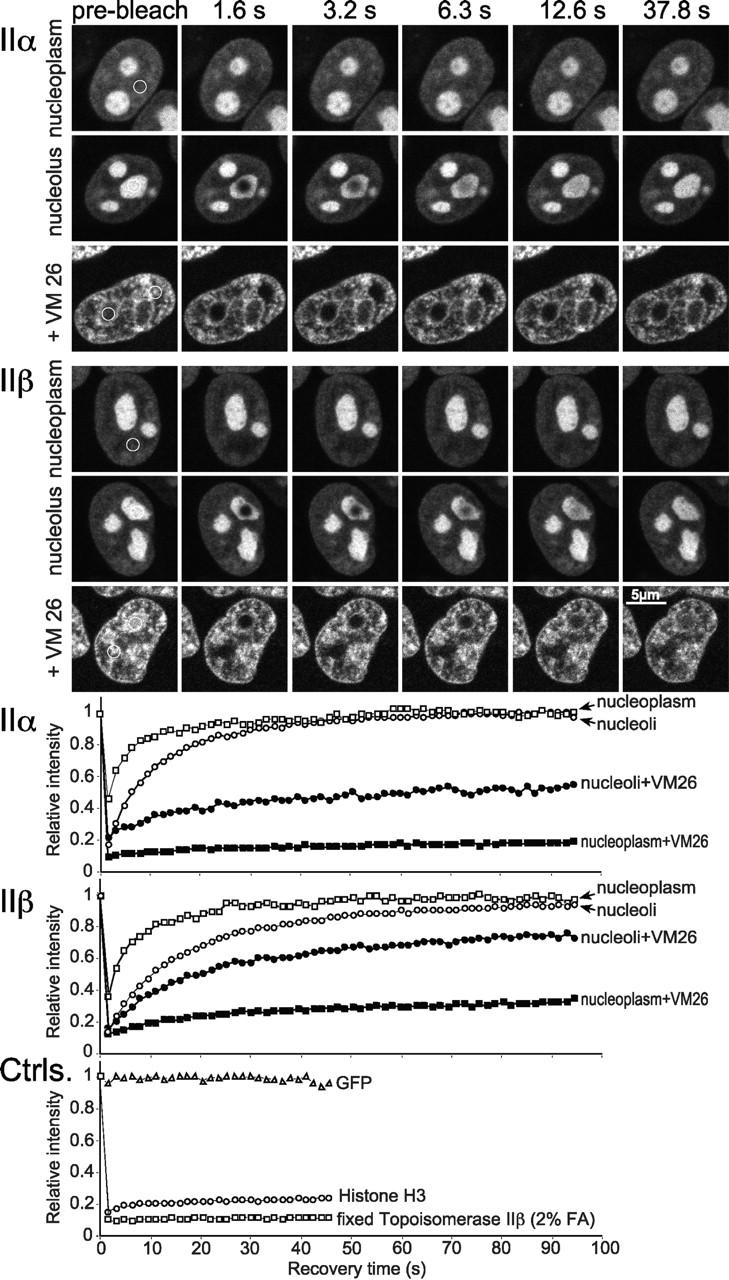
FRAP analysis of topo II–GFP. Cells expressing GFP chimera of topo IIα and IIβ were bleached for 1.8 s. Images were taken before bleaching and at the indicated time points after the end of the bleach pulse. The area to be bleached is indicated by a circle in the prebleach panels. In VM 26–treated cells a nucleolar or a nucleoplasmic region was bleached simultaneously in the same cell, whereas in untreated cells each compartment was bleached in separate cells. Corresponding quantitative data of fluorescence recovery kinetics are plotted below. Fluorescence intensities in the bleached region were measured and expressed as the relative recovery over time. Values represent means from at least six individual cells and three independent experiments. Standard deviations were in each case <5% of the mean values (unpublished data). FRAP kinetics of freely diffusible GFP, chromatin-bound histone H3-GFP and formaldehyde-fixed topo IIβ–GFP served as controls.