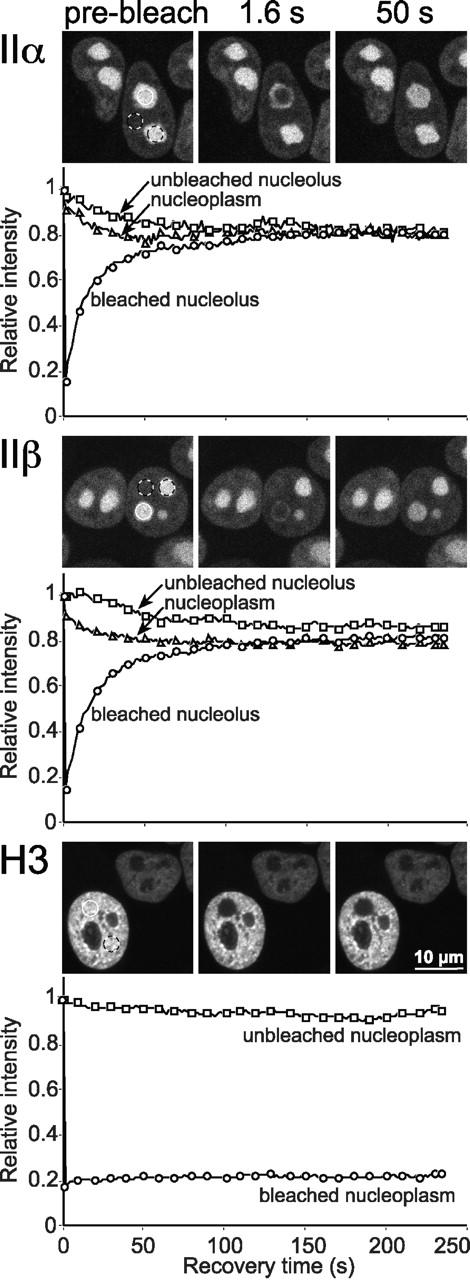
Figure 6.

Exchange between nucleoplasmic and nucleolar topo II–GFP. Cells expressing GFP chimera of topo IIα, IIβ, and histone H3, respectively, were bleached and analyzed as in Fig. 5 with two exceptions: (a) A larger area (3 μm diam; white circle) was bleached to achieve a substantial loss of total cellular fluorescence. (b) The relative recovery over time in the bleach spot and the relative loss of fluorescence intensity in unbleached areas (black and white circles) is plotted below each image panel. Plotted data were not corrected for the overall loss of fluorescence induced by the bleach pulse (∼20%), to allow a quantitative comparison of signal loss in unbleached areas with signal gain in the bleached area. For greater clarity, only every tenth data point is marked by a symbol.
