
Figure 7.
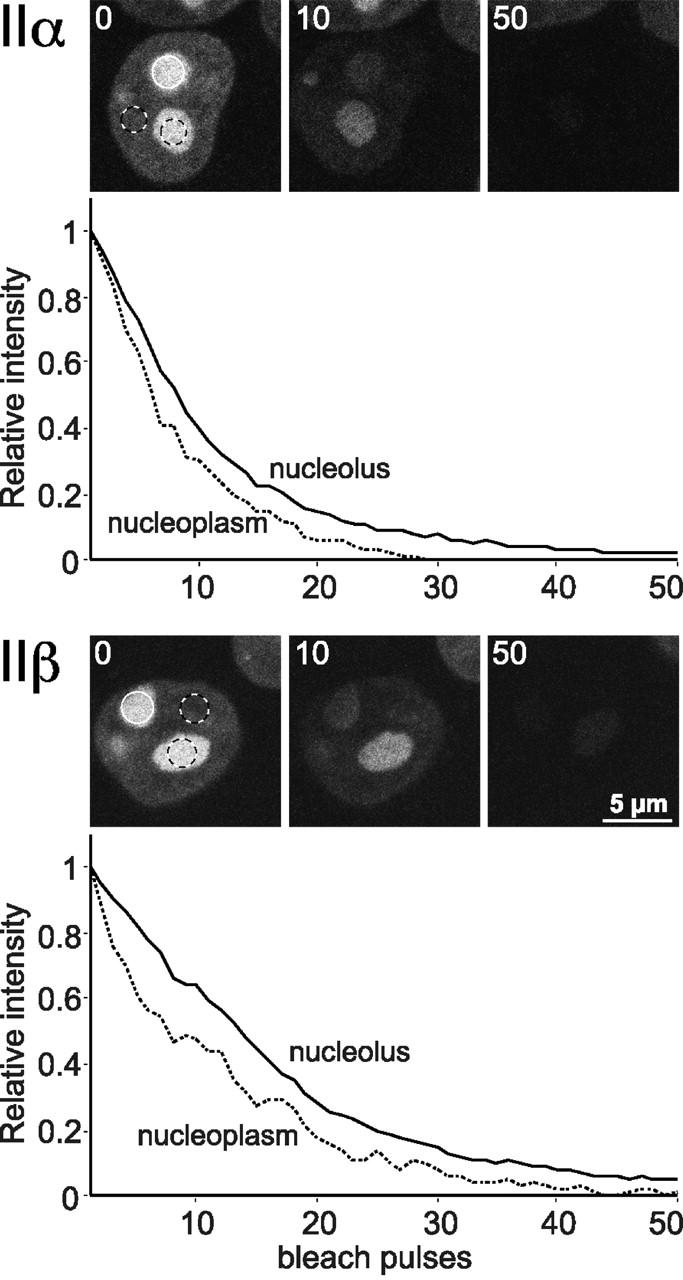
FLIP analysis of interphase topo II–GFP. Nucleoli of cells expressing topo IIα–GFP or topo IIβ–GFP were repeatedly bleached in a circular area (3 μm diam; white circles). Cells were imaged before each new bleach pulse, and fluorescence intensities of neighboring nucleoli and nucleoplasmic areas (black and white circles) were determined. Almost all fluorescence was lost from both compartments after 50 bleach cycles, indicating a high exchange rate between nucleolar and nucleoplasmic topo II.