
Figure 9.
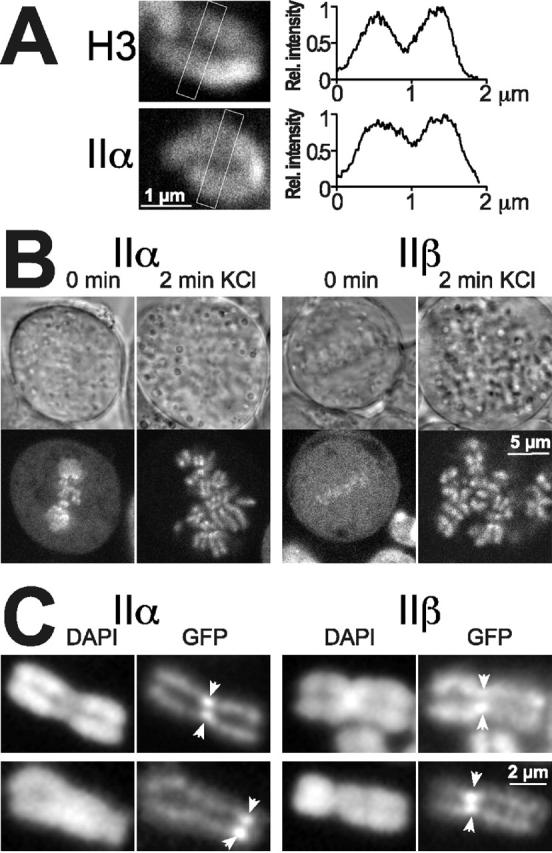
Chromosomal distribution of topo II. (A) Single chromosomes in living metaphase cells expressing topo IIα–GFP or GFP-histone H3 were imaged by high resolution confocal microscopy. Distribution of fluorescence intensity was quantified in the boxed cross sections of the chromosomes. Mean fluorescence intensity of pixel columns across the short diameter of the boxes was normalized to maximal values, and plotted against corresponding distances measured across the long diameter of the boxes (right). (B) Effect of hypotonic treatment on topo II distribution in metaphase. Two cells expressing topo IIα–GFP or topo IIβ–GFP were imaged by confocal microscopy before (0 min) and 2 min after exchanging the medium for KCl solution (75 mM). Images of transmitted light are shown above a corresponding confocal section showing green fluorescence of the same cell. Note the substantial increase in size of KCl-treated cells. (C) Subchromosomal distribution and stability of topo II isoforms in unfixed, spread chromosomes. Cells expressing topo IIα–GFP or topo IIβ–GFP were harvested, collected by centrifugation, swollen in hypotonic solution, and spotted on glass slides without fixation. Spread chromosomes were mounted in DAPI-containing CSK buffer and imaged either immediately (top) or 2 h later (bottom) using filter sets for the specific detection of the DNA stain (DAPI) and the green fluorescence (GFP), respectively. Arrowheads mark the position of centromere pairs.