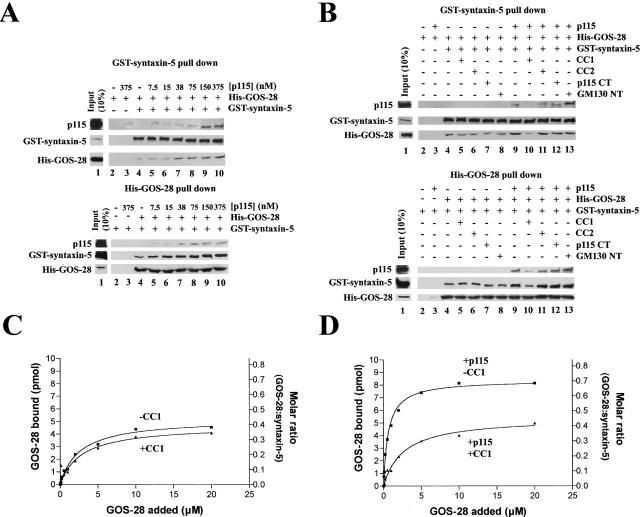
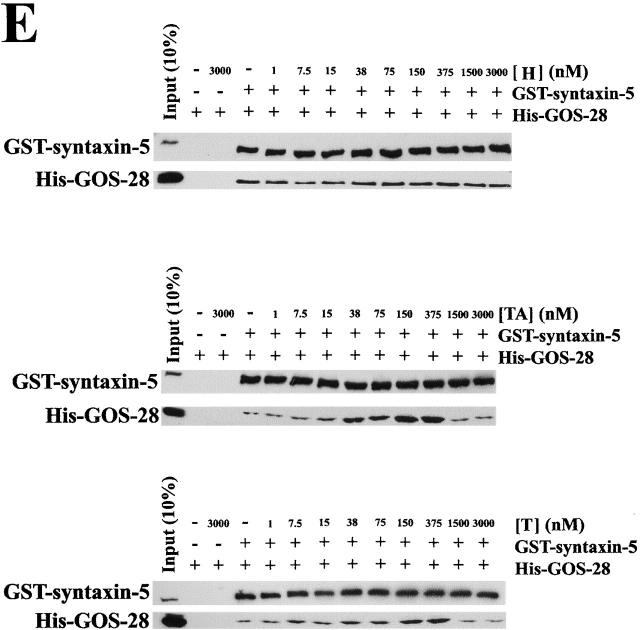
Figure 7.
p115 stimulates complex formation between His–GOS-28 and GST–syntaxin-5. (A) GST–syntaxin-5 (75 nM) was incubated for 1 h on ice with His–GOS-28 (75 nM) and increasing concentrations of p115 (0–375 nM). GST–syntaxin-5 (top) or His–GOS-28 (bottom) was retrieved. Controls omitted the SNARE to be retrieved plus or minus p115. Bound proteins were processed for immunoblot. For the p115 immunoblot, the input (10%) lane reflects 10% of the maximum p115 concentration added (375 nM). (B) GST–syntaxin-5 (75 nM) was incubated for 1 h on ice with His–GOS-28 (75 nM) in the presence or absence of p115 (150 nM) with or without 15 μM CC1 or CC2, 30 μM p115 CT, or GM130 NT. GST–syntaxin-5 (top) or His–GOS-28 (bottom) was retrieved. Controls omitted the SNARE to be retrieved plus or minus p115. Reactions were processed as in A. Note the longer exposure time required to detect the coprecipitated SNARE (His–GOS-28, top, and GST–syntaxin-5, bottom). (C and D) GST–syntaxin-5 (12 pmol) was incubated for 1 h on ice with increasing concentrations of His–GOS-28 (0–20 μM) in the presence or absence of CC1 (20 μM), plus (D) or minus (C) p115 (0.2 μM). GST–syntaxin-5 was retrieved. Reactions were processed as in A. The amount of His–GOS-28 bound was determined by densitometry. Datapoints represent means (n = 3), and binding isotherms were fitted. (E) Reactions were performed as in A except p115 was replaced with His-H, His-TA, or His-T (0–3 μM).


