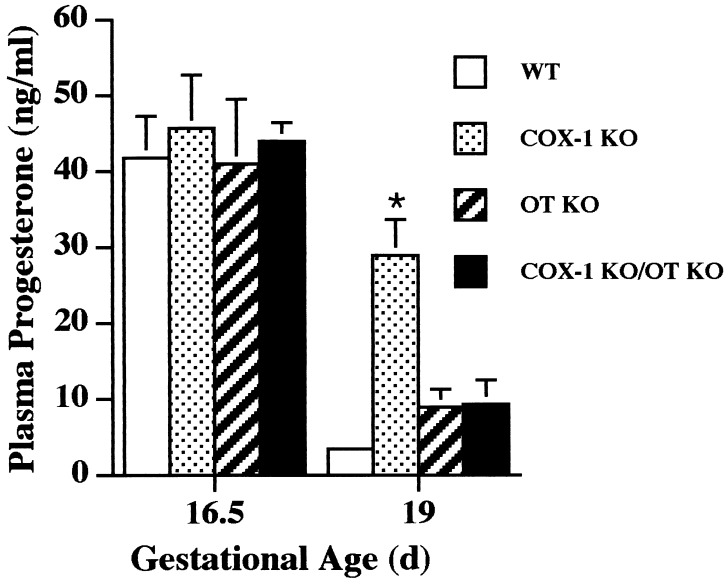
Figure 3.
Plasma progesterone concentration in COX-1 KO, OT KO, and COX-1 KO/OT KO mice. Blood was collected by retroorbital phlebotomy in n = 4–6 mice per genotype group, and plasma progesterone concentration was determined. Data are presented as mean ± SEM. ∗, P < 0.01 vs. wt, OT KO, and COX-1 KO/OT KO at day 19.

